Samples / Universal Diagramming / Illustration
Illustration
Early humans created cave paintings and maps, artifacts that could be considered the very first instances of infographics. Some examples of early infographics include an ancient map at the Neolithic site Çatalhöyük, which dates from around 7500 BCE, as well as imagery used by the Indians of Mesoamerica to depict journeys of past generations. These artifacts often served as supportive elements to memory and storytelling, not as the stand-alone graphics often seen in the 21st Century. [Wikipedia]
Tutorials and Solutions:
Video Tutorials: ConceptDraw Solution Park
Solutions: Metro Map, ConceptDraw DIAGRAM
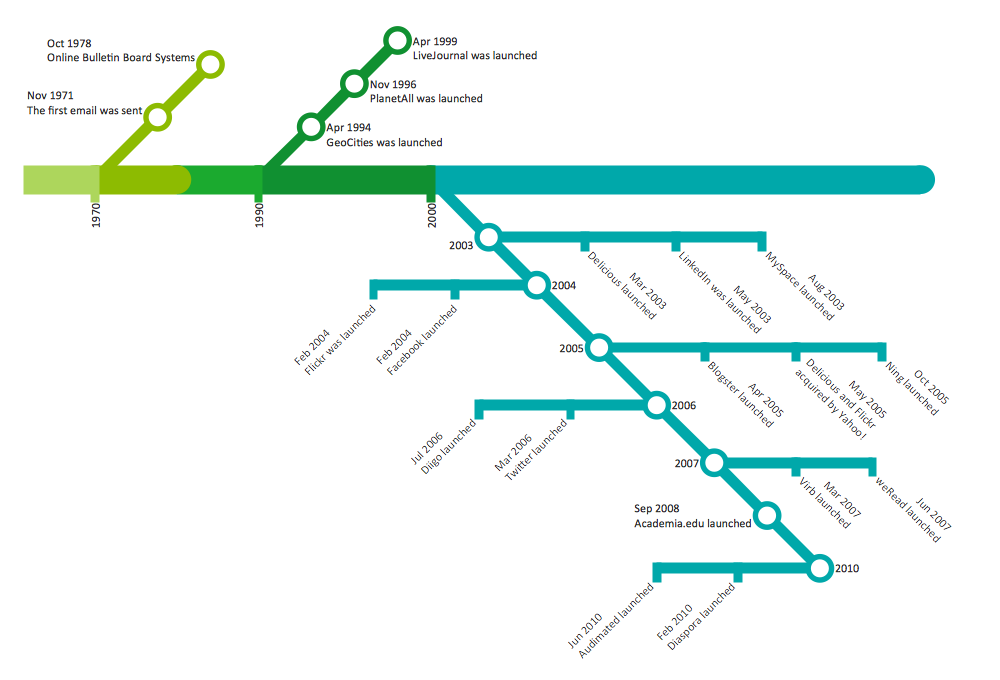
Sample 1: Metro Map Style Infographics — Chronology of Social Networks
Metro Map style infographics sample: Chronology of social networks
This infographics example is created using ConceptDraw DIAGRAM diagramming and vector drawing software enhanced with Metro Map solution from ConceptDraw Solution Park.
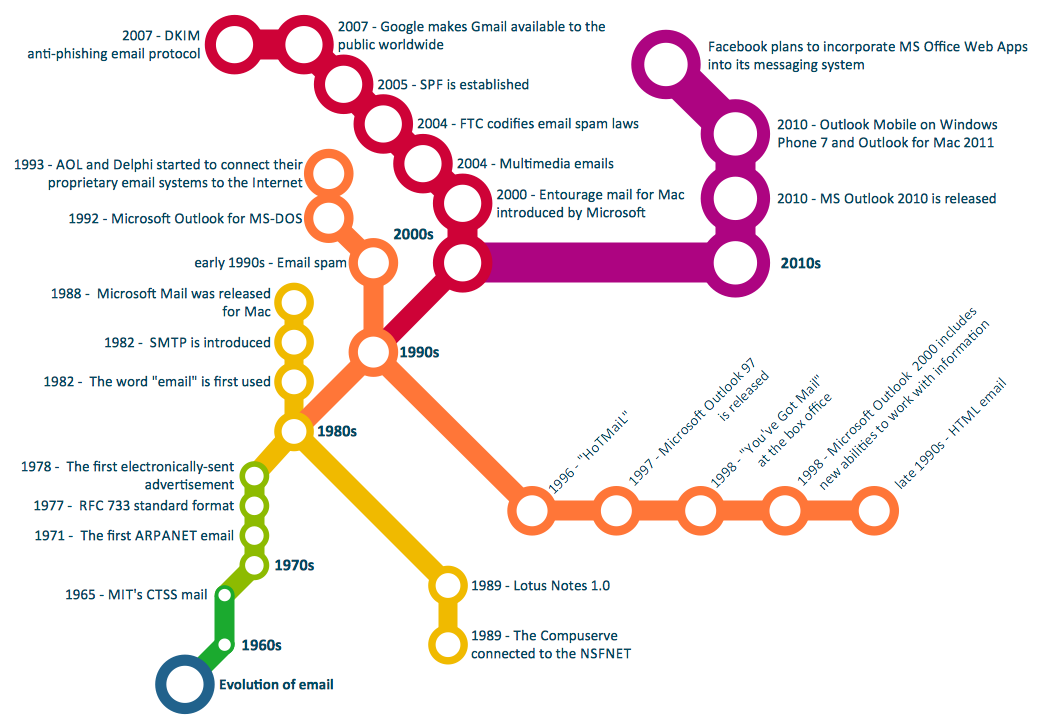
Sample 2: Metro Map Style Infographics — Email History Map
Metro Map style infographics sample: Email history map.
This infographics example is created using ConceptDraw DIAGRAM diagramming and vector drawing software enhanced with Metro Map solution from ConceptDraw Solution Park.
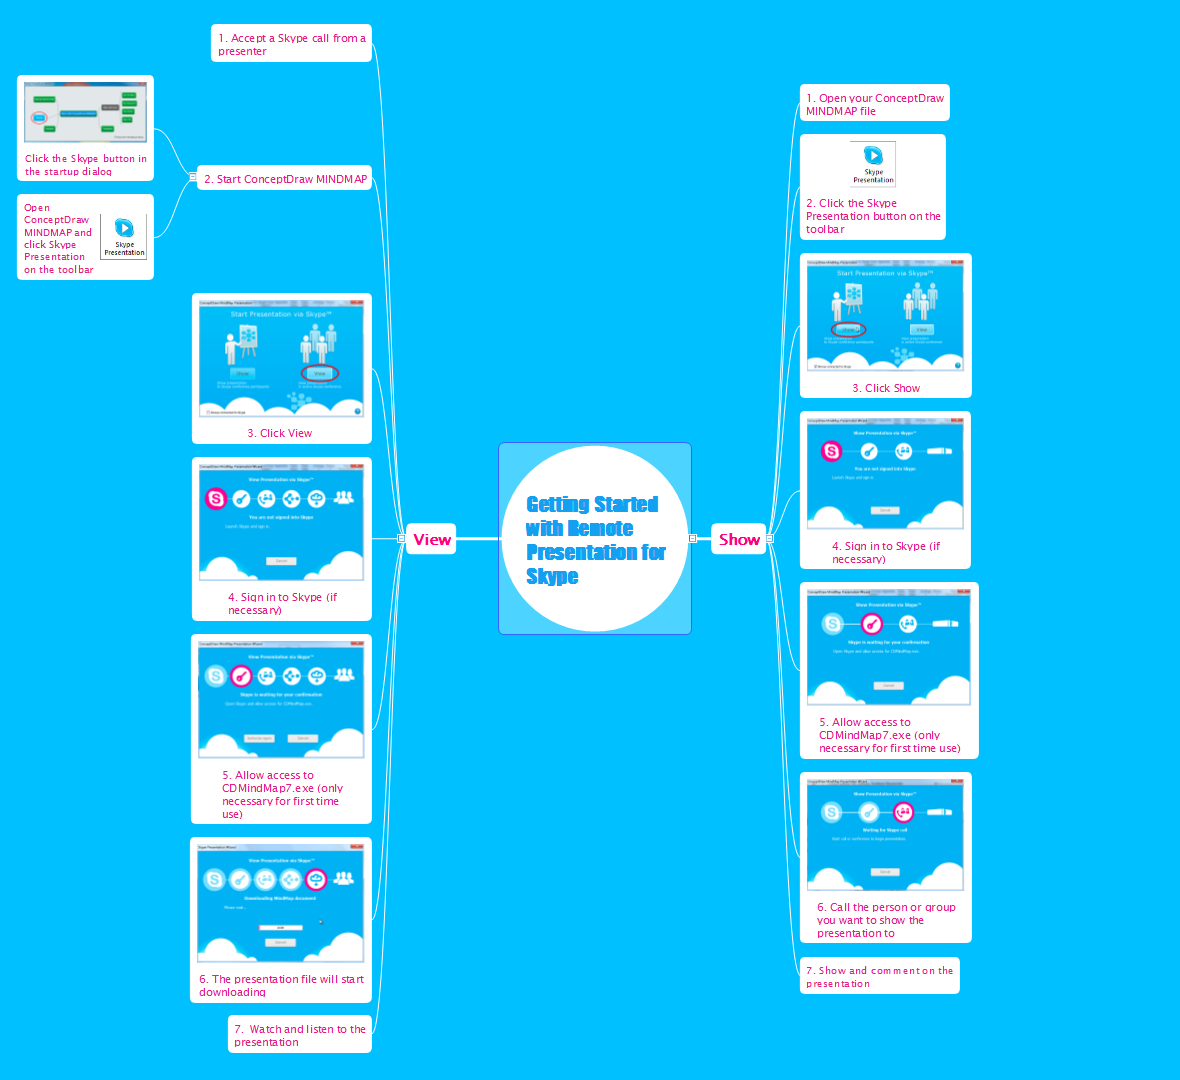
Sample 3: Skype Infographic — Remote Presentation for Skype
Remote Presentation for Skype sample: Getting started.
This example is created with ConceptDraw MINDMAP mind mapping software enhanced with Remote Presentation for Skype solution from ConceptDraw Solution Park.
All samples are copyrighted CS Odessa's.
Usage of them is covered by Creative Commons “Attribution Non-Commercial No Derivatives” License.
The text you can find at: https://creativecommons.org/licenses/by-nc-nd/3.0