New in the ConceptDraw Help Desk
Welcome to the new “Visual Dashboards” area of ConceptDraw Help Desk. This area was developed to deliver ConceptDraw uses a better experience when using ConceptDraw Visual Dashboards. Here are the top popular articles in the new ConceptDraw Help Desk area:
How to Create a Sales Dashboard
With ConceptDraw PRO you can easily create a visual Sales Dashboard using a single screen to integrate a set of charts and graphic indicators that visualizes the performance of a sales process in your organization.
Read more
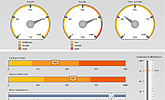
How to Connect MS Excel Data to a Time Series Chart
on Your Sales Dashboard
You can connect a Visual Dashboard with Excel data source files to display the actual values of Key Performance Indicators using graphic Indicators such as Gauges, Meters, Bullets, and Sliders.
Read more
How to Connect Dashboard to a Text Data Source
In ConceptDraw PRO you can easily create a custom Visual Dashboard using charts and graphic indicators used as Live Objects, connecting them to data source files and then displaying the results.
Read more

Related Videos