Local area network (LAN). Computer and Network Examples
 diagram")

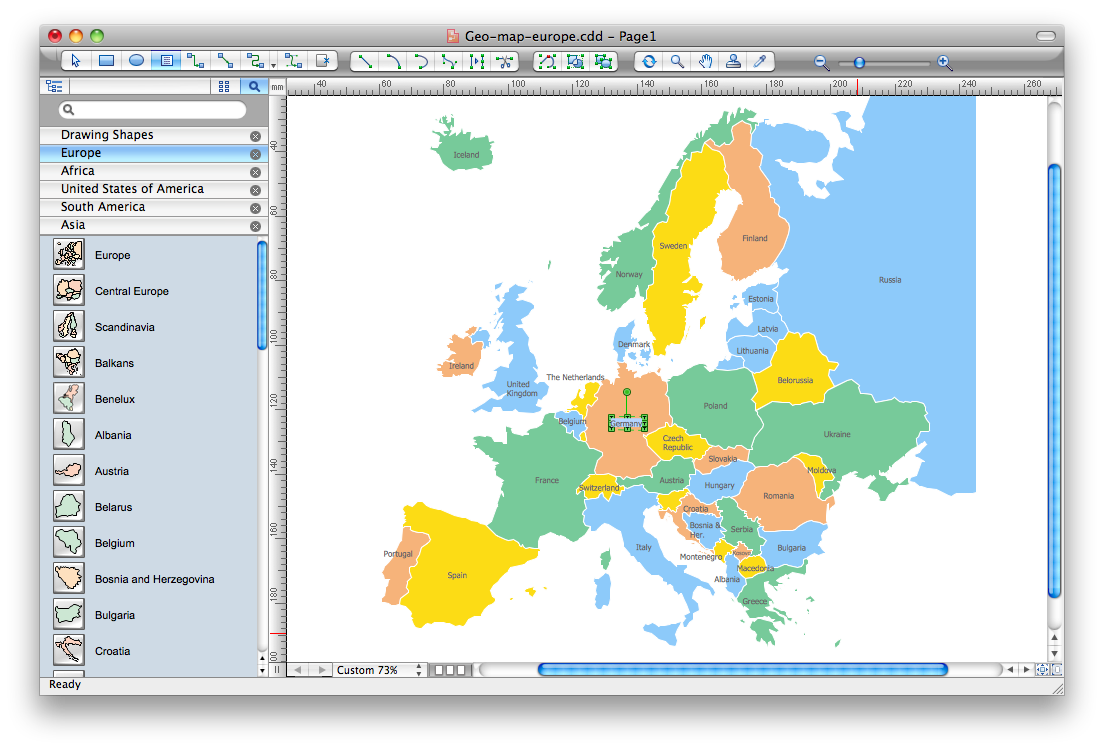
Map Software
Bar Chart

Flow chart Example. Warehouse Flowchart


Pictorial Chart

Sample Pictorial Chart. Sample Infographics

This area chart sample shows the population growth of San Francisco, California from 1850-2005. It was redesigned from the Wikimedia Commons file: San Francisco CA Population Growth.svg. [commons.wikimedia.org/ wiki/ File:San_ Francisco_ CA_ Population_ Growth.svg]
"The San Francisco Bay Area, commonly known as the Bay Area, is a populated region that surrounds the San Francisco and San Pablo estuaries in Northern California, United States. The region encompasses the major cities and metropolitan areas of San Francisco, Oakland, and San Jose, along with smaller urban and rural areas. The Bay Area's nine counties are Alameda, Contra Costa, Marin, Napa, San Francisco, San Mateo, Santa Clara, Solano, and Sonoma. Home to approximately 7.44 million people, the nine-county Bay Area contains many cities, towns, airports, and associated regional, state, and national parks, connected by a network of roads, highways, railroads, bridges, tunnels and commuter rail. The combined urban area of San Francisco and San Jose is the second largest in California (after the Greater Los Angeles area), the fifth largest in the United States, and the 56th largest urban area in the world." [San Francisco Bay Area. Wikipedia]
The area graph example "San Francisco CA Population Growth" was created using the ConceptDraw PRO diagramming and vector drawing software extended with the Area Charts solution from the Graphs and Charts area of ConceptDraw Solution Park.
Area chart

Rainfall Bar Chart

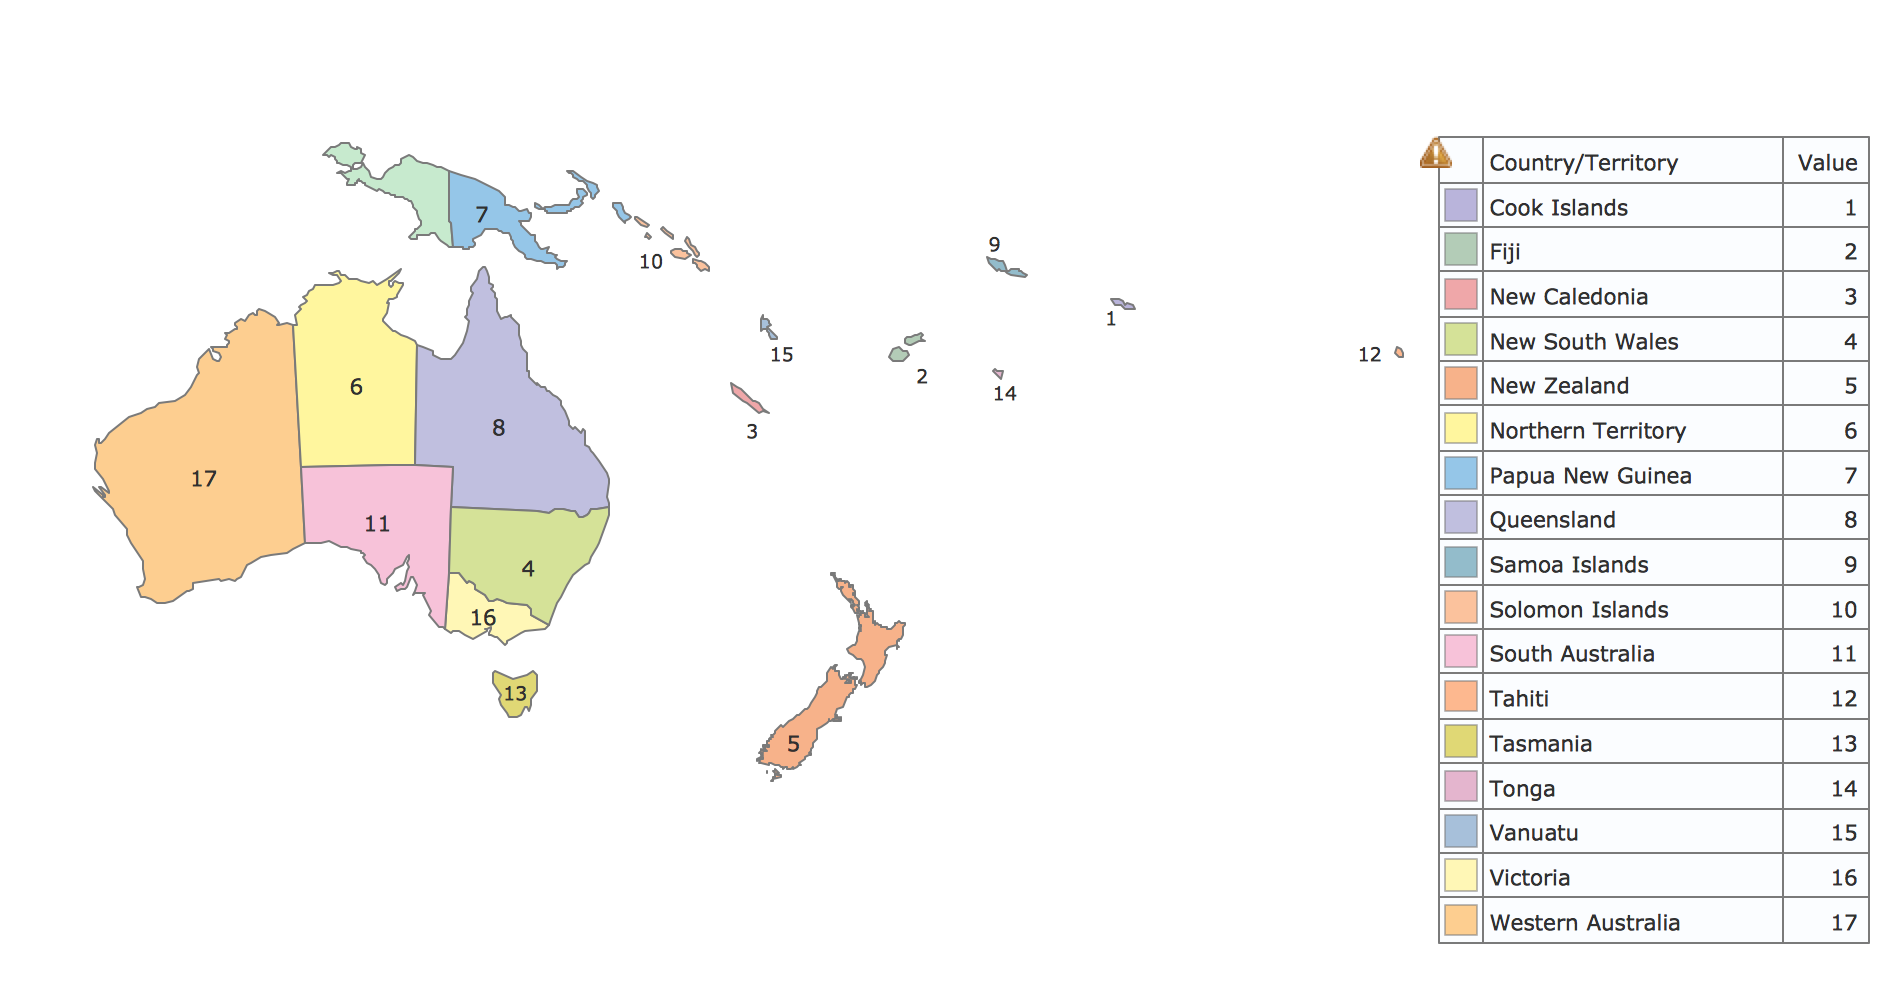
Geo Map - Oceania
BPR Diagram. Business Process Reengineering Example

- Example Of Chart Diagram Of Showing World Population
- The most spoken languages of the world | Bar Chart | Basic Bar ...
- Images On World Population For Chart Making
- Line Chart Examples | Line Graph | Basic Diagramming | World ...
- Local area network (LAN). Computer and Network Examples ...
- Bar Graph On Area Of Seven Continent
- Geo Map - Asia | Pictures of Graphs | Picture Graph | World ...
- World Population Chart Drawing
- Line Chart Examples | Population growth by continent | San ...
- Basic Diagramming | Line Chart Examples | Line Graph | Population ...