Scrum process work items and workflow

Cross-Functional Flowchart


Scrum board

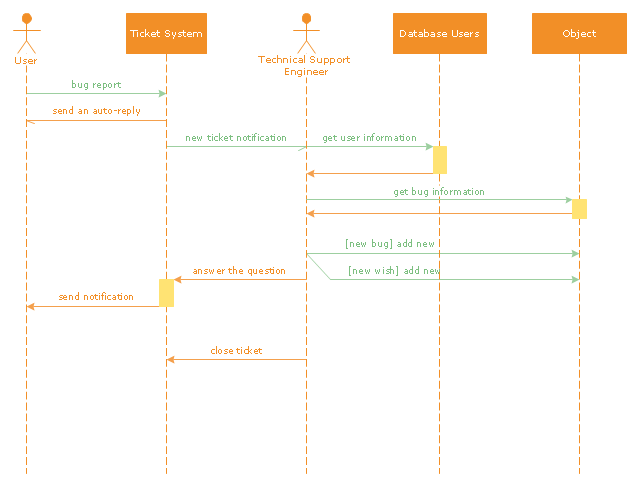
"An example scenario is presented to demonstrate how a common issue tracking system would work:
(1) A customer service technician receives a telephone call, email, or other communication from a customer about a problem. Some applications provide built-in messaging system and automatic error reporting from exception handling blocks.
(2) The technician verifies that the problem is real, and not just perceived. The technician will also ensure that enough information about the problem is obtained from the customer. This information generally includes the environment of the customer, when and how the issue occurs, and all other relevant circumstances.
(3) The technician creates the issue in the system, entering all relevant data, as provided by the customer.
(4) As work is done on that issue, the system is updated with new data by the technician. Any attempt at fixing the problem should be noted in the issue system. Ticket status most likely will be changed from open to pending.
(5) After the issue has been fully addressed, it is marked as resolved in the issue tracking system.
If the problem is not fully resolved, the ticket will be reopened once the technician receives new information from the customer. A Run Book Automation process that implements best practices for these workflows and increases IT personnel effectiveness is becoming very common." [Issue tracking system. Wikipedia]
The UML sequence diagram example "Ticket processing system" was created using the ConceptDraw PRO diagramming and vector drawing software extended with the Rapid UML solution from the Software Development area of ConceptDraw Solution Park.
UML sequence diagram
 Project Management Area
Project Management area provides Toolbox solutions to support solving issues related to planning, tracking, milestones, events, resource usage, and other typical project management functions.
HelpDesk
How to Track Your Project Plan vs. the Actual Project Condition

 PM Dashboards
The PM Dashboards solution extends the management boundaries of ConceptDraw PRO and ConceptDraw PROJECT products with an ability to demonstrate changes to the budget status, to show the project progress toward its objectives, to display clearly the identified key performance indicator (KPI) or the set of key performance indicators for any project. This solution provides you with examples and ability to generate three types of visual dashboards reports based on your project data Project Dashboard, Tactical Dashboard, and Radar Chart. By dynamically charting the project’s key performance indicators that are collected on one ConceptDraw PRO document page, all project participants, project managers, team members, team leaders, stakeholders, and the entire organizations, for which this solution is intended, have access to the daily status of projects they are involved in.

 Aerospace and Transport
This solution extends ConceptDraw PRO software with templates, samples and library of vector clipart for drawing the Aerospace and Transport Illustrations. It contains clipart of aerospace objects and transportation vehicles, office buildings and anci
"Task management is the process of managing tasks through its life cycle. It involves planning, testing, tracking and reporting. Task management can help either individuals achieve goals, or groups of individuals collaborate and share knowledge for the accomplishment of collective goals. Tasks are also differentiated by complexity, from low to high.
Effective task management requires managing all aspects of a task, including its status, priority, time, human and financial resources assignments, recurrency, notifications and so on. These can be lumped together broadly into the basic activities of task management. ...
Task management may form part of project management and process management and can serve as the foundation for efficient workflow in an organisation. Project managers adhering to task-oriented management have a detailed and up-to-date project schedule, and are usually good at directing team members and moving the project forward. ...
Task life cycle.
The status of tasks can be described by the following states:
Ready,
Assigned,
Terminated,
Expired,
Forwarded,
Finished,
Failed." [Task management. Wikipedia]
The example "Project management task status dashboard" was created using the ConceptDraw PRO diagramming and vector drawing software extended with the Status Dashboard solution from the area "What is a Dashboard" of ConceptDraw Solution Park.
Status dashboard

Audit Flowchart Symbols

"A document management system (DMS) is a computer system (or set of computer programs) used to track and store electronic documents. It is usually also capable of keeping track of the different versions modified by different users (history tracking). The term has some overlap with the concepts of content management systems. It is often viewed as a component of enterprise content management (ECM) systems and related to digital asset management, document imaging, workflow systems and records management systems. ...
Document management systems commonly provide storage, versioning, metadata, security, as well as indexing and retrieval capabilities." [Document management system. Wikipedia]
The block diagram example "Document management system architecture" was created using the ConceptDraw PRO diagramming and vector drawing software extended with the Block Diagrams solution from the area "What is a Diagram" of ConceptDraw Solution Park.
System architecture diagram

HelpDesk
How to Use ConceptDraw Sales Dashboard Solution


HelpDesk
How to Create a Gantt Chart for Your Project

- Agile Methodology | PM Agile | Scrum Workflow | Scrum Agile ...
- PM Agile | Scrum Workflow | Scrum board | Scrum Task
- Agile Methodology | PM Agile | Scrum Workflow | Agile Methods Scrum
- Scrum workflow | Scrum board | Scrum process work items and ...
- Scrum Workflow | Agile Methodology | ConceptDraw Solution Park ...
- Scrum | Scrum Workflow | Project Management Area | What Is Scrum ...
- PM Agile | Scrum process work items and workflow | How to Create ...
- Scrum Workflow | Scrum | PM Agile | Management Scrum
- PM Agile | Scrum Workflow | ConceptDraw Solution Park | Scrum Plan
- Scrum workflow | Scrum Workflow
- Scrum board | Scrum Workflow | Scrum process work items and ...
- PM Agile | Scrum Workflow | Scrum process work items and ...
- Scrum | Scrum process work items and workflow | Agile ...
- Scrum Workflow | Scrum board | Scrum process work items and ...
- Scrum workflow | Scrum | Scrum process work items and workflow ...
- PM Agile | Agile Methodology | Scrum Workflow | Scrum In Agile ...
- Scrum Workflow | Scrum | PM Agile | Agile Development ...
- Scrum Workflow | Scrum workflow | Scrum board | Scrum Design
- Scrum Workflow | Agile Methodology | Scrum process work items ...