HelpDesk
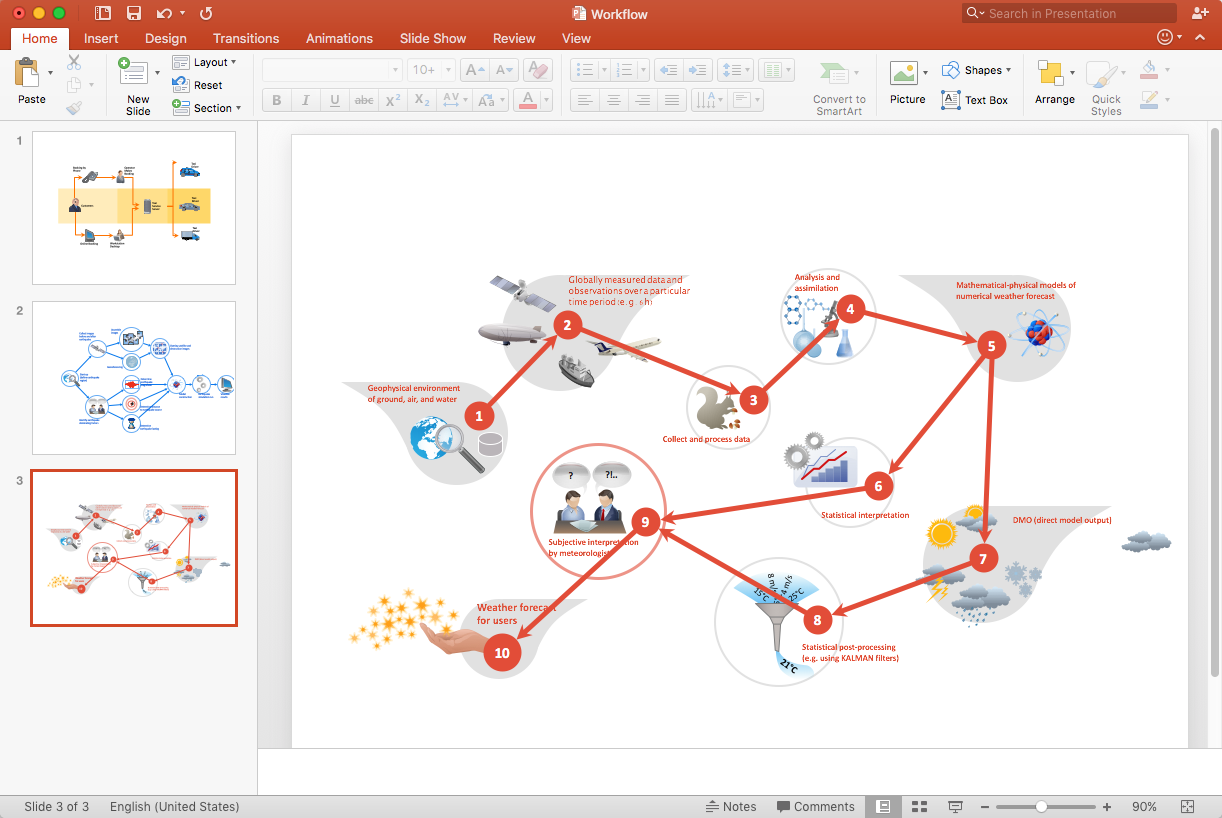
How to Add a Workflow Diagram to a PowerPoint Presentation
Basic Flowchart Symbols and Meaning


Export from ConceptDraw DIAGRAM Document to PPT or PPTX (MS PowerPoint®) File

Best Mind Mapping Program for Making Presentations

Export from ConceptDraw MINDMAP to PowerPoint® Presentation


to MS PowerPoint
Process Flowchart


Data Flow Diagram

HelpDesk
How to Add a Cross-Functional Flowchart to a PowerPoint Presentation

Fishbone Diagram Template

Software Work Flow Process in Project Management with Diagram

This sample shows the Workflow Diagram that clearly illustrates stages a BPM consists of and relations between all parts of business. The Workflow Diagrams are used to represent the transferring of data during the work process, to study and analysis the working processes, and to optimize a workflow.
- Logistics Flow Charts | Scrum Workflow | Free Work Flow Ppt
- How to Add a Workflow Diagram to a PowerPoint Presentation Using
- How to Add a Workflow Diagram to a PowerPoint Presentation ...
- Workflow Diagrams | Workflow Presentation Software
- Agile Scrum Ppt
- Bussiness Process Sample On Ppt
- SWOT Analysis | How to Add a Workflow Diagram to a PowerPoint ...
- Scrum Workflow | Sprint Retrospective | Sprint Backlog | Sprint ...
- Business Process Optimization Ppt