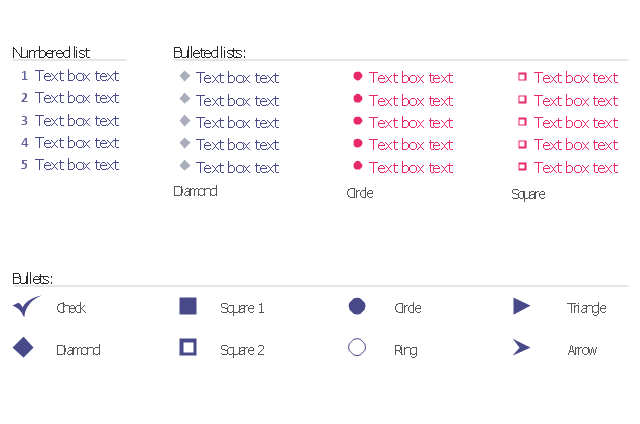
The vector stencils library "Bulleted and numbered lists" contains 12 elements of bulleted and numbered lists, and bullets for creating typography infographics.
"In typography, a bullet ( • ) is a typographical symbol or glyph used to introduce items in a list. ... The bullet symbol may take any of a variety of shapes, such as circular, square, diamond, arrow, etc., and typical word processor software offer a wide selection of shapes and colours. Several regular symbols are conventionally used in ASCII-only text or another environments where bullet characters are not available, such as * (asterisk), - (hyphen), . (period), and even o (lowercase O). Of course, when writing by hand, bullets may be drawn in any style. Historically, the index symbol was popular for similar uses." [Bullet (typography). Wikipedia]
The example "Design elements - Bulleted and numbered lists" was created using the ConceptDraw PRO diagramming and vector drawing software extended with the Typography Infographics solition from the area "What is infographics" in ConceptDraw Solution Park.
Typography infographics elements - Bulleted and numbered lists
Geo Map - USA - Connecticut

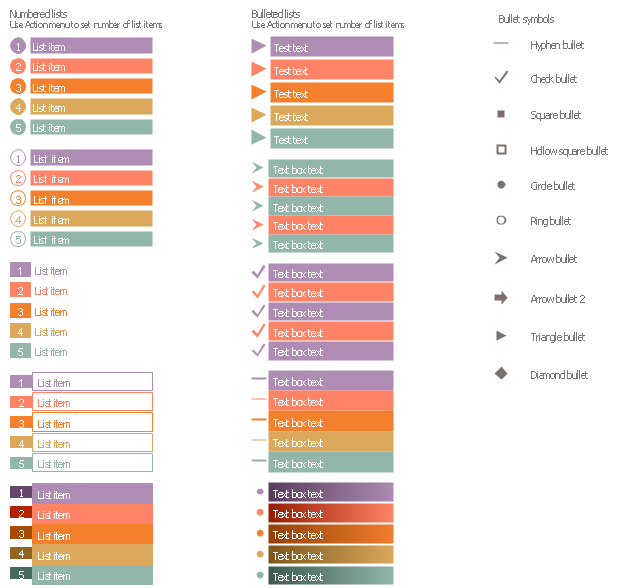
The vector stencils library "List blocks" contains 20 numbered list elements, bulleted list elements and bullet symbols for creating marketing infograms.
"In typography, a bullet ( • ) is a typographical symbol or glyph used to introduce items in a list. ...
The bullet symbol may take any of a variety of shapes, such as circular, square, diamond, arrow, etc., and typical word processor software offer a wide selection of shapes and colours. ...
Bullets are most often used in technical writing, reference works, notes and presentations." [Bullet (typography). Wikipedia]
The shapes example "Design elements - List blocks" was created using the ConceptDraw PRO diagramming and vector drawing software extended with the Marketing Infographics solition from the area "Business Infographics" in ConceptDraw Solution Park.
Lists
 Scrum Workflow
The Scrum Workflow Solution extends the capabilities of ConceptDraw PRO 10 with a large collection of professionally-designed samples and a selection of ready-to-use scrum design elements: scrum diagrams and arrows, scrum icons of people, artifacts, workflow, workspace and other colorful scrum clipart, and also scrum charts.
ERD Symbols and Meanings


Basic Flowchart Symbols and Meaning


Financial Trade UML Use Case Diagram Example

 macOS User Interface
macOS User Interface solution extends the ConceptDraw PRO functionality with powerful GUI software graphic design features and tools. It provides an extensive range of multifarious macOS Sierra user interface design examples, samples and templates, and wide variety of libraries, containing a lot of pre-designed vector objects of Mac Apps icons, buttons, dialogs, menu bars, indicators, pointers, controls, toolbars, menus, and other elements for fast and simple designing high standard user interfaces of any complexity for new macOS Sierra.
 Education Package
Education Package is a comprehensive set of multifarious graphical solutions from ConceptDraw Solution Park, collected together in help to ConceptDraw PRO users working in a field of science, education and training, which is aimed at improving the quality of education and helping to design with ease variety of interesting and colorful educational materials, diagrams, charts and maps. Use it to present the information and knowledge in an interesting, clear, structured and simple form to achieve a success in education and pedagogy, to maintain the interest of students and pupils throughout the whole learning process, at the lectures, lessons and even during independent work with additional materials, to contribute to better perception of scientific information by listeners during the conferences and reports.
- Bullet Librery Png
- Sales dashboard - Vector stencils library | Pie Chart | Pie Chart Word ...
- ABC - Vector stencils library | Design elements - Callouts | Design ...
- Circle Bullets
- Bullet Library Ms Word Png
- Diamond Bullets
- Design elements - Bulleted and numbered lists | Design elements ...
- Bullet Points Vector
- Bullet Trains Png
- Circle Bullet