Basic Flowchart Symbols and Meaning


ERD Symbols and Meanings


Process Flowchart


 Meter Dashboard
Meter dashboard solution extends ConceptDraw PRO software with templates, samples and vector stencils library with meter indicators for drawing visual dashboards showing quantitative data.
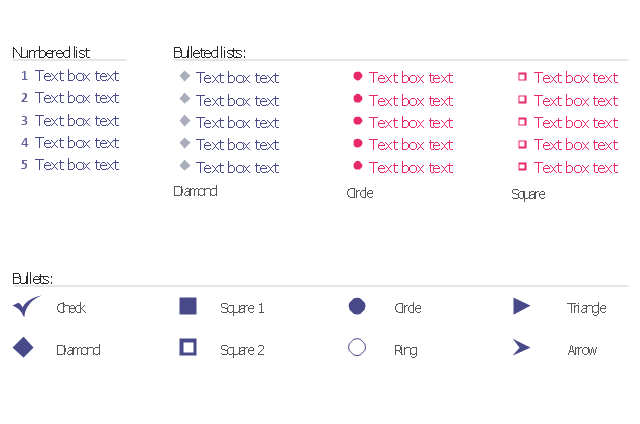
The vector stencils library "Bulleted and numbered lists" contains 12 elements of bulleted and numbered lists, and bullets for creating typography infographics.
"In typography, a bullet ( • ) is a typographical symbol or glyph used to introduce items in a list. ... The bullet symbol may take any of a variety of shapes, such as circular, square, diamond, arrow, etc., and typical word processor software offer a wide selection of shapes and colours. Several regular symbols are conventionally used in ASCII-only text or another environments where bullet characters are not available, such as * (asterisk), - (hyphen), . (period), and even o (lowercase O). Of course, when writing by hand, bullets may be drawn in any style. Historically, the index symbol was popular for similar uses." [Bullet (typography). Wikipedia]
The example "Design elements - Bulleted and numbered lists" was created using the ConceptDraw PRO diagramming and vector drawing software extended with the Typography Infographics solition from the area "What is infographics" in ConceptDraw Solution Park.
Typography infographics elements - Bulleted and numbered lists
 AWS Architecture Diagrams
AWS Architecture Diagrams with powerful drawing tools and numerous predesigned Amazon icons and AWS simple icons is the best for creation the AWS Architecture Diagrams, describing the use of Amazon Web Services or Amazon Cloud Services, their application for development and implementation the systems running on the AWS infrastructure. The multifarious samples give you the good understanding of AWS platform, its structure, services, resources and features, wide opportunities, advantages and benefits from their use; solution’s templates are essential and helpful when designing, description and implementing the AWS infrastructure-based systems. Use them in technical documentation, advertising and marketing materials, in specifications, presentation slides, whitepapers, datasheets, posters, etc.
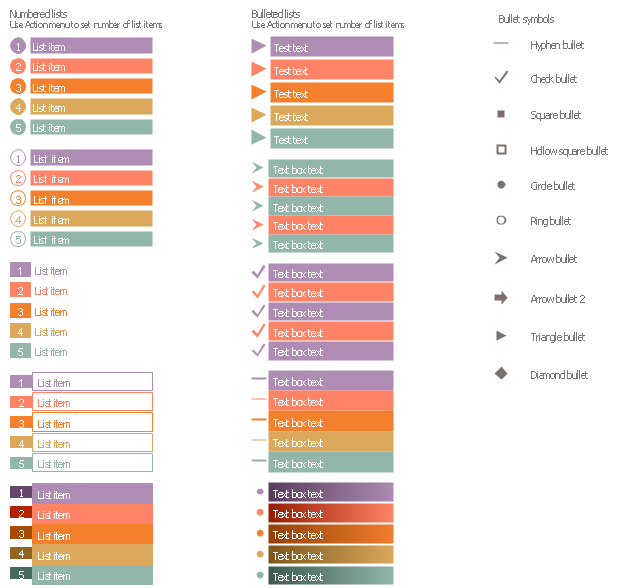
The vector stencils library "List blocks" contains 20 numbered list elements, bulleted list elements and bullet symbols for creating marketing infograms.
"In typography, a bullet ( • ) is a typographical symbol or glyph used to introduce items in a list. ...
The bullet symbol may take any of a variety of shapes, such as circular, square, diamond, arrow, etc., and typical word processor software offer a wide selection of shapes and colours. ...
Bullets are most often used in technical writing, reference works, notes and presentations." [Bullet (typography). Wikipedia]
The shapes example "Design elements - List blocks" was created using the ConceptDraw PRO diagramming and vector drawing software extended with the Marketing Infographics solition from the area "Business Infographics" in ConceptDraw Solution Park.
Lists
 Specification and Description Language (SDL)
For people in the field of systems engineering or system design, working with specification and description language (sdl) and finite state machines (fsm).
 IDEF Business Process Diagrams
Use the IDEF Business Process Diagrams solution to create effective database designs and object-oriented designs, following the integration definition methodology.
 Scrum Workflow
The Scrum Workflow Solution extends the capabilities of ConceptDraw PRO 10 with a large collection of professionally-designed samples and a selection of ready-to-use scrum design elements: scrum diagrams and arrows, scrum icons of people, artifacts, workflow, workspace and other colorful scrum clipart, and also scrum charts.
- Bullet Librery Png
- Bullet Trains Png
- Bullet Point Png
- List Bullet Png
- Diamond Bullets
- Design elements - Bulleted and numbered lists | Design elements ...
- How to Diagram Sentences in ConceptDraw PRO | How to Draw a ...
- Bullet Symbols Png File
- How to Create a Typography Infographic Using ConceptDraw PRO ...