Sales Growth. Bar Graphs Example

Bar Chart Template

Bar Chart Template for Word

Column Chart Examples

Use this bar graph template to design your column charts for 1-4 data series.
"Bar charts have a discrete range. Bar charts are usually scaled so all the data can fit on the chart. Bars on the chart may be arranged in any order. Bar charts arranged from highest to lowest incidence are called Pareto charts. Normally, bars showing frequency will be arranged in chronological (time) sequence. Grouped bar graph usually present the information in the same order in each grouping. Stacked bar graphs present the information in the same sequence on each bar.
Bar charts provide a visual presentation of categorical data. Categorical data is a grouping of data into discrete groups, such as months of the year, age group, shoe sizes, and animals. These categories are usually qualitative. In a column bar chart, the categories appear along the horizontal axis; the height of the bar corresponds to the value of each category." [Bar chart. Wikipedia]
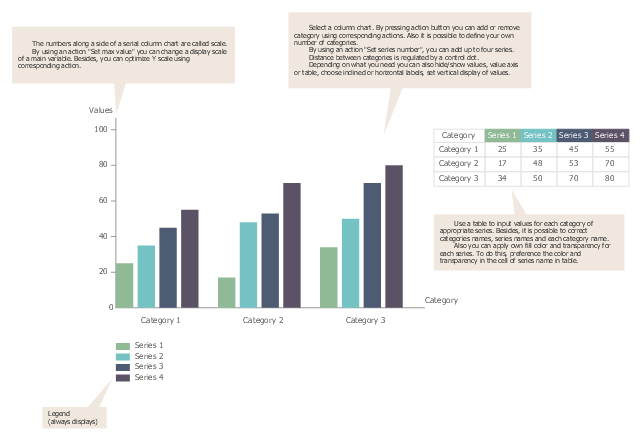
The template "Bar chart" for the ConceptDraw PRO diagramming and vector drawing software is included in the Bar Graphs solution from the Graphs and Charts area of ConceptDraw Solution Park.
"Bar charts have a discrete range. Bar charts are usually scaled so all the data can fit on the chart. Bars on the chart may be arranged in any order. Bar charts arranged from highest to lowest incidence are called Pareto charts. Normally, bars showing frequency will be arranged in chronological (time) sequence. Grouped bar graph usually present the information in the same order in each grouping. Stacked bar graphs present the information in the same sequence on each bar.
Bar charts provide a visual presentation of categorical data. Categorical data is a grouping of data into discrete groups, such as months of the year, age group, shoe sizes, and animals. These categories are usually qualitative. In a column bar chart, the categories appear along the horizontal axis; the height of the bar corresponds to the value of each category." [Bar chart. Wikipedia]
The template "Bar chart" for the ConceptDraw PRO diagramming and vector drawing software is included in the Bar Graphs solution from the Graphs and Charts area of ConceptDraw Solution Park.
Template
The vector stencils library "Picture Graphs" contains 35 templates of picture bar graphs for visual data comparison and time series.
Drag a template from the library to your document, set bars number, type category labels, select bars and enter your data.
Use these shapes to draw your pictorial bar charts in the ConceptDraw PRO diagramming and vector drawing software.
The vector stencils library "Picture Graphs" is included in the Picture Graphs solution from the Graphs and Charts area of ConceptDraw Solution Park.
Arrow
Water drop

Food

Grain

Agriculture

Medicines

Houses

Buildings

Money bags

Oil barrels

Natural gas

Electrical power

Nuclear power

Mechanical engineering

Chemical industry

Mining

Gold bars

Coins

Person

Men, women and children

Man

Woman

Child

Milk

Meat

Fruits

Vegetables

Computer

Mobile phone

Airliner

Car

Bus

Truck

Train

Cargo ship

Competitor Analysis

Scatter Graph

 Basic Picture Graphs
This solution extends the capabilities of ConceptDraw DIAGRAM (or later) with templates, samples and a library of vector stencils for drawing Picture Graphs.
Pyramid Chart Examples

- Appropriate Graphs Of Gold Mining
- Divided Bar Diagrams | Make Uses Of Appropriate Graphics Graphs ...
- Use Appropriate Examples Pictures And Graphs
- Rainfall Bar Chart | Bar Graph | Picture Graphs | Bar Graph Image ...
- Graphs Appropriate Graphics Of Gold Mining
- Composition Dashboard | Bar Graphs | Design elements - Education ...
- Make Use Of Appropriate Graphs Photographs Sketches To Support
- How to Create a Picture Graph in ConceptDraw PRO | Bar Graphs ...
- Make Use Of Appropriate Graphics Graphs Photographs Sketches ...