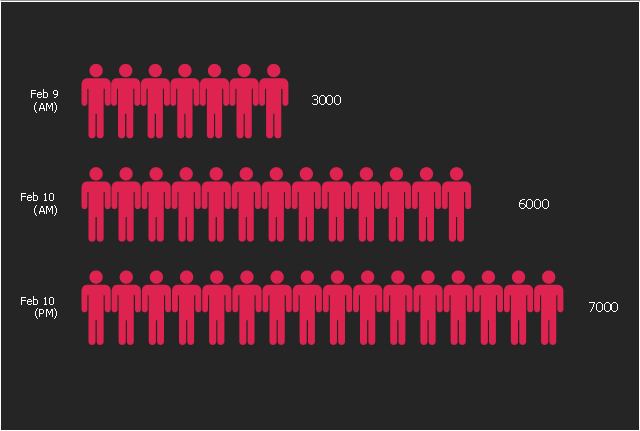
Sales Growth. Bar Graphs Example

This pictorial bar chart sample was redesigned from the Wikimedia Commons file: Barrie Population.jpg.
[commons.wikimedia.org/ wiki/ File:Barrie_ Population.jpg]
"Barrie is a city in Central Ontario, Canada, on the western shore of Lake Simcoe. Although located in Simcoe County, the city is politically independent. Barrie is within the northern part of the Greater Golden Horseshoe, a densely populated and industrialized region of Ontario.
In 2011 census, the city's population was originally reported as 135,711, making it the 34th largest in Canada. The city's 2011 population was subsequently revised to 136,063. The Barrie census metropolitan area (CMA) had a population of 187,013 residents, making it the 21st largest CMA in Canada." [Barrie. Wikipedia]
The picture bar graph example "Barrie population" was created using the ConceptDraw PRO diagramming and vector drawing software extended with the Picture Graphs solution from the Graphs and Charts area of ConceptDraw Solution Park.
Picture bar graph

Bar Graph

Chart Software for Better Presentations

Graphs and Charts Area provide a wide collection of professional looking predesigned templates, samples and ready-to-use vector stencils that will help you to draw the charts and diagrams of various types: Pie Charts, Donut Charts, Line Charts, Column Charts, Bar Charts, Pyramids, Scatter Charts, Venn Diagrams, Spider Charts, Area Charts, Divided Bar Graphs.
Bar Chart Examples

What Is a Picture Graph?

 Picture Graphs
Typically, a Picture Graph has very broad usage. They many times used successfully in marketing, management, and manufacturing. The Picture Graphs Solution extends the capabilities of ConceptDraw PRO v10 with templates, samples, and a library of professionally developed vector stencils for designing Picture Graphs.
Bar Diagrams for Problem Solving. Create space science bar charts with Bar Graphs Solution

Create bar graphs for visual solving your scientific problems and data comparison using the ConceptDraw PRO diagramming and vector drawing software extended with the Bar Graphs Solution from the Graphs and Charts area of ConceptDraw Solition Park.
Bar Diagrams for Problem Solving. Create business management bar charts with Bar Graphs Solution

Picture Graph

Rainfall Bar Chart

This sample was created in ConceptDraw PRO diagramming and vector drawing software using the Bar Graphs Solution from the Graphs and Charts area of ConceptDraw Solution Park.
Pictures of Graphs

"Anonymous (used as a mass noun) is a loosely associated international network of activist and hacktivist entities. A website nominally associated with the group describes it as "an internet gathering" with "a very loose and decentralized command structure that operates on ideas rather than directives". The group became known for a series of well-publicized publicity stunts and distributed denial-of-service (DDoS) attacks on government, religious, and corporate websites.
Anonymous originated in 2003 on the imageboard 4chan, representing the concept of many online and offline community users simultaneously existing as an anarchic, digitized global brain. Anonymous members (known as "Anons") can be distinguished in public by the wearing of stylised Guy Fawkes masks." [Anonymous (group). Wikipedia]
This pictorial bar graph sample was redesigned from the Wikimedia Commons file: A graph to show the increse in subscibers on YouTube to Anonymous' videos.jpg. [commons.wikimedia.org/ wiki/ File:A_ graph_ to_ show_ the_ increse_ in_ subscibers_ on_ YouTube_ to_ Anonymous%27_ videos.jpg]
This file is licensed under the Creative Commons Attribution 3.0 Unported license. [creativecommons.org/ licenses/ by/ 3.0/ deed.en]
The picture chart example "The increse in subscibers on YouTube to Anonymous' videos" was created using the ConceptDraw PRO diagramming and vector drawing software extended with the Picture Graphs solution from the Graphs and Charts area of ConceptDraw Solution Park.
Picture bar graph
Bar Diagrams for Problem Solving. Create economics and financial bar charts with Bar Graphs Solution

The vector stencils library "Picture Graphs" contains templates of picture bar graphs for visual data comparison. Use these shapes to draw your pictorial bar charts in the ConceptDraw PRO diagramming and vector drawing software extended with the Picture Graphs solution from the Graphs and Charts area of ConceptDraw Solution Park.
Arrow picture graph (control dots)
Arrow picture graph (text -> height)
Picture graph (person)
-picture-graphs---vector-stencils-library.png--diagram-flowchart-example.png)
Picture graph (coins)
-picture-graphs---vector-stencils-library.png--diagram-flowchart-example.png)
- Bar Graphs | Line Graphs | Sales Growth. Bar Graphs Example ...
- Pictures Of Bar Graphs
- Barrie population - Picture bar graph | Picture graphs - Vector ...
- Sales Growth. Bar Graphs Example | What Is a Picture Graph ...
- Sales Growth. Bar Graphs Example | Picture Graphs | Picture Graph ...
- Pie Graph Worksheets | What Is a Picture Graph? | Bar Graph ...
- Picture Graphs | Sales Growth. Bar Graphs Example | Picture Graph ...
- Picture Graphs | Sales Growth. Bar Graphs Example | Barrie ...
- Picture Line Graph And Bar Graph
- Picture Graphs | Picture Graph | How to Create a Picture Graph in ...
- Barrie population - Picture bar graph | Design elements - Picture ...
- Picture Graphs | How to Create a Picture Graph in ConceptDraw ...
- Picture Graphs | Sales Growth. Bar Graphs Example | Chart Maker ...
- Graphs and Charts Area | Bar Graphs | Picture Graphs | Charts Graphs
- Line Graphs | Bar Graphs | Line Graph Charting Software | Graph
- Picture Graphs | Picture Graph | Basic Diagramming | Bar Graph ...
- Picture graph - Template | Design elements - Picture graphs | Picture ...
- Barrie population - Picture bar graph | Total value of manufacturers ...
- Picture Graph | Picture Graphs | Bar Chart | Bar Chart Image
- Barrie population - Picture bar graph | Pictures of Graphs | Sales ...