Flow Chart for Olympic Sports

Winter Sports Vector Clipart. Medal Map. Spatial Infographics

Bar Diagrams for Problem Solving. Create event management bar charts with Bar Graphs Solution

Design Pictorial Infographics. Design Infographics

Flowchart

 25 Typical Orgcharts
The 25 Typical Orgcharts solution contains powerful organizational structure and organizational management drawing tools, a variety of professionally designed organization chart and matrix organization structure samples, 25 templates based on various orga
Mind Map Making Software

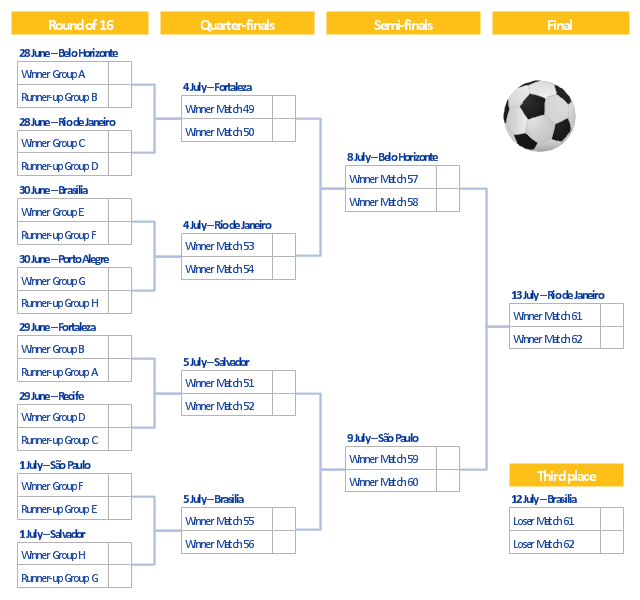
This example of a single-elimination tournament bracket was created on the base of the diagram from the Wikipedia article "2014 FIFA World Cup". [en.wikipedia.org/ wiki/ 2014_ FIFA_ World_ Cup]
"A single-elimination tournament - also called an Olympic system tournament, a knockout, single penetration, or sudden death tournament - is a type of elimination tournament where the loser of each bracket is immediately eliminated from winning the championship or first prize in the event.
This does not always mean that the defeated competitor will not participate further in the tournament; in some such tournaments, consolation or "classification" contests are subsequently held among those already defeated to determine the awarding of lesser places, for example, a third place playoff.
Where more than two competitors can play in each match, such as in a shootout poker tournament, players are removed when they can no longer play until one player remains from the group. This player moves on to the next round.
A simple way to describe a single-elimination tournament is that the winner of each match moves on and the loser fails to progress in the tournament.
Some competitions are held with a pure single-elimination tournament system. Others have many phases, with the last being a single-elimination final stage called playoffs." [Single-elimination tournament. Wikipedia]
The football (soccer) single-elimination tournament bracket diagram example "2014 FIFA World Cup - Knockout stage" was created using the ConceptDraw PRO diagramming and vector drawing software extended with the Soccer solution from the Sport area of ConceptDraw Solution Park.
Single-elimination tournament bracket
- Flow Chart for Olympic Sports | Flow Chart Design - How to Design a ...
- Flow Chart for Olympic Sports | Creating a Simple Flowchart | Flow ...
- Ice Hockey Offside Diagram | Winter Olympics pictograms - Vector ...
- Winter Sports | Bar Diagrams for Problem Solving. Create event ...
- Algorithm flowchart - Selection sorting method | Flow Chart for ...
- Sport pictograms. Olympic Games | Influence Diagram Software ...
- Process Flow Chart Symbols | Business People Figures | Types of ...
- Winter Olympics - Skeleton | Basketball Court Dimensions | Sports ...
- Diagram Of Olympic
- Basic Audit Flowchart. Flowchart Examples | Flow Chart for Olympic ...
- Basic Diagramming | Winter Sports. Olympic Games Infographics ...
- Winter Sports. Olympic Games Infographics. Medal Table | Winter ...
- Software Development | Water cycle diagram | Chore charts with ...
- Sport pictograms. Olympic Games | Winter Olympics pictograms ...
- Winter Olympics - Figure skating | Winter Sports | Winter Sports ...
- Entity Relationship Diagram Racing Game
- Winter Sports. Olympic Games Infographics. Medal Table | Winter ...
- Winter Sports | Winter Sports. Olympic Games Infographics. Medal ...
- Winter Sports. Olympic Games Infographics. Medal Table | Winter ...