 Fishbone Diagram
Fishbone Diagrams solution extends ConceptDraw PRO software with templates, samples and library of vector stencils for drawing the Ishikawa diagrams for cause and effect analysis.
Create Fishbone Diagrams with the ConceptDraw

 Management
This solution extends ConceptDraw PRO v9 and ConceptDraw MINDMAP v7 with Management Diagrams and Mind Maps (decision making, scheduling, thinking ideas, problem solving, business planning, company organizing, SWOT analysis, preparing and holding meetings
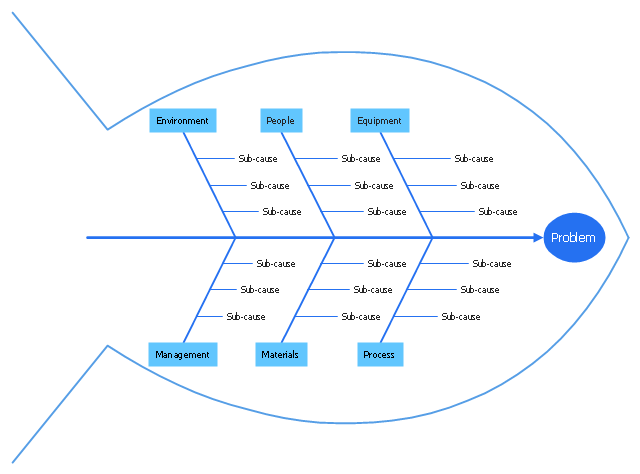
"Common uses of the Ishikawa diagram are product design and quality defect prevention, to identify potential factors causing an overall effect. Each cause or reason for imperfection is a source of variation. Causes are usually grouped into major categories to identify these sources of variation. The categories typically include:
(1) People: Anyone involved with the process;
(2) Methods: How the process is performed and the specific requirements for doing it, such as policies, procedures, rules, regulations and laws;
(3) Machines: Any equipment, computers, tools, etc. required to accomplish the job;
(4) Materials: Raw materials, parts, pens, paper, etc. used to produce the final product;
(5) Measurements: Data generated from the process that are used to evaluate its quality;
(6) Environment: The conditions, such as location, time, temperature, and culture in which the process operates. ...
Ishikawa diagrams were popularized by Kaoru Ishikawa in the 1960s, who pioneered quality management processes in the Kawasaki shipyards, and in the process became one of the founding fathers of modern management.
The basic concept was first used in the 1920s, and is considered one of the seven basic tools of quality control." [Ishikawa diagram. Wikipedia]
This quality Ishikawa diagram (cause and effect diagram) template is included in the Fishbone Diagram solution from the Management area of ConceptDraw Solution Park.
Quality fishbone diagram
The library of vector stencils "Fishbone diagrams" contains 13 symbols for drawing the Ishikawa diagrams using the ConceptDraw PRO diagramming and vector drawing software.
"Ishikawa diagrams were popularized by Kaoru Ishikawa in the 1960s, who pioneered quality management processes in the Kawasaki shipyards, and in the process became one of the founding fathers of modern management.
The basic concept was first used in the 1920s, and is considered one of the seven basic tools of quality control. It is known as a fishbone diagram because of its shape, similar to the side view of a fish skeleton." [Ishikawa diagram. Wikipedia]
"The Seven Basic Tools of Quality is a designation given to a fixed set of graphical techniques identified as being most helpful in troubleshooting issues related to quality. They are called basic because they are suitable for people with little formal training in statistics and because they can be used to solve the vast majority of quality-related issues.
The seven tools are:
(1) Cause-and-effect diagram (also known as the "fishbone" or Ishikawa diagram);
(2) Check sheet;
(3) Control chart;
(4) Histogram;
(5) Pareto chart;
(6) Scatter diagram;
(7) Stratification (alternately, flow chart or run chart)." [Seven Basic Tools of Quality. Wikipedia]
The example "Design elements - Fishbone diagram" is included in the Fishbone Diagrams solution from the Management area of ConceptDraw Solution Park.
Ishikawa diagram symbols

 PM Response
This solution extends all ConceptDraw Office 2.0 products by helping to improve the response time to project changes. PM Response also helps with iteration planning, discussing project layout approaches, and solving project challenges.
Total Quality Management with ConceptDraw
 method - Fishbone diagram template")
 Project Exchange
This solution extends ConceptDraw PROJECT and ConceptDraw MINDMAP software with the ability to import and export project data.
 Project Management Area
Project Management area provides Toolbox solutions to support solving issues related to planning, tracking, milestones, events, resource usage, and other typical project management functions.
 ConceptDraw Solution Park
ConceptDraw Solution Park collects graphic extensions, examples and learning materials
 Metro Map
Metro Map solution extends ConceptDraw PRO software with templates, samples and library of vector stencils for drawing the metro maps, route maps, bus and other transport schemes, or design tube-style infographics.
 PM Easy
This solution extends ConceptDraw PROJECT software with the ability to quickly start a project; it lists task relationships and dependencies to make iterative planning easy.
 Audio, Video, Media
This solution extends ConceptDraw PRO software with samples, templates and library of vector clipart of audio, media, video and photo equipment for drawing the illustrations.
 PM Teams
This solution extends ConceptDraw Office 2.0 products with a single information space for messaging to teams.
 People
This solution extends ConceptDraw PRO software with samples, templates and libraries of vector clipart for drawing the People illustrations. Use it to make professional-looking documents, presentations and websites illustrated with color scalable vector c
 Value Stream Mapping
Value stream mapping solution extends ConceptDraw PRO software with templates, samples and vector stencils for drawing the Value Stream Maps (VSM) in lean manufacturing practice.
 Rapid UML
Rapid UML solution extends ConceptDraw PRO software with templates, samples and libraries of vector stencils for quick drawing the UML diagrams using Rapid Draw technology.
 Word Exchange
This solution extends ConceptDraw MINDMAP software with the ability to quickly create the framework for a future article or book, fill the structure with ideas, and use it to produce an MS Word document with just a simple click of the mouse.
- Business Productivity Diagramming | Fishbone Diagram ...
- Fishbone Diagram | Total Quality Management with ConceptDraw ...
- Fishbone Diagram | Business Productivity ... - Conceptdraw .com
- Fishbone Diagram | Cause and Effect Analysis ( Fishbone Diagrams ...
- Fishbone Diagram | Metro Map | Basic ... - Conceptdraw .com
- ConceptDraw PRO Compatibility with MS Visio | Fishbone Diagram ...
- Fishbone Diagram | Management | ConceptDraw Solution Park |
- Total Quality Management with ConceptDraw | Total Quality ...
- ConceptDraw Solution Park | Fishbone Diagram | SWOT Analysis |
- Fishbone Diagram | ConceptDraw Solution Park | ConceptDraw ...
- Fishbone Diagram | ConceptDraw Solution Park | Business ...
- ConceptDraw Solution Park | Fishbone Diagram | Cross-Functional ...
- Business Process Diagram | Fishbone Diagram | Business Process ...
- Fishbone Diagram | Business Productivity Diagramming ...
- Fishbone Diagram | Management | ConceptDraw Solution Park |
- UML Diagrams with ConceptDraw PRO | Basic Diagramming ...
- Fishbone Diagram | Marketing Diagrams | ConceptDraw Solution Park
- Business Process Modeling with ConceptDraw | Event-driven ...
- Fishbone Diagram | ConceptDraw Solution Park | Aerospace and ...
- Fishbone Diagram | ConceptDraw PRO Compatibility with MS Visio ...