 Website Wireframe
The innovative Website Wireframe solution enhances the ConceptDraw PRO v10 functionality with newest wireframe tools, libraries with variety of predesigned icons, symbols, buttons, graphics, forms, boxes, and many other vector elements, templates and professionally designed samples, which make it the best wireframing software. Website Wireframe solution gives you significant advantages when designing and maintaining websites, creating skeletal and content-free depictions of website structure, making website prototypes and planning the content arrangement before committing to design, also speeds up the processes of sketching, producing and sharing wireframe examples of website style and interface design.
Example of DFD for Online Store (Data Flow Diagram) DFD Example


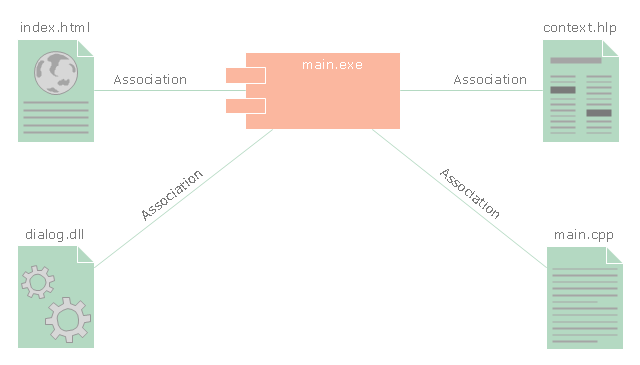
"In the Unified Modeling Language, a component diagram depicts how components are wired together to form larger components and or software systems. They are used to illustrate the structure of arbitrarily complex systems." [Component diagram. Wikipedia]
This UML component diagram example was created using the ConceptDraw PRO diagramming and vector drawing software extended with the Rapid UML solution from the Software Development area of ConceptDraw Solution Park.
This UML component diagram example was created using the ConceptDraw PRO diagramming and vector drawing software extended with the Rapid UML solution from the Software Development area of ConceptDraw Solution Park.
UML component diagram
Website Wireframe

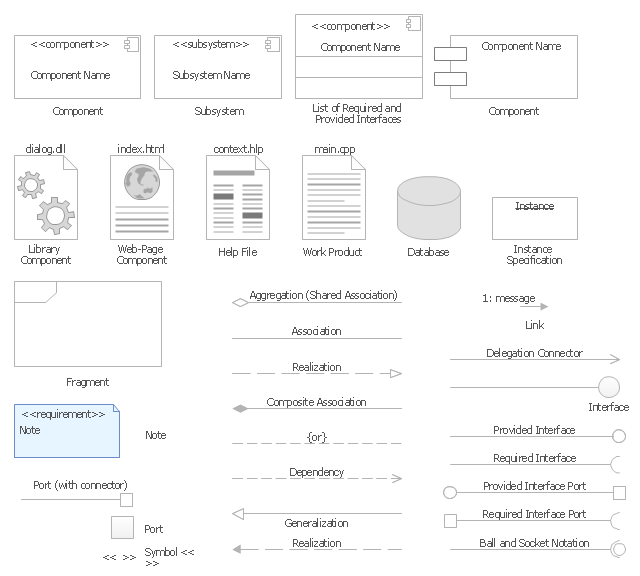
The vector stencils library "UML component diagrams" contains 36 symbols for the ConceptDraw PRO diagramming and vector drawing software.
"In the Unified Modeling Language, a component diagram depicts how components are wired together to form larger components and or software systems. They are used to illustrate the structure of arbitrarily complex systems. ...
Symbols.
This may have a visual stereotype in the top right of the rectangle of a small rectangle with two even smaller rectangles jutting out on the left.
The lollipop, a small circle on a stick represents an implemented or provided interface. The socket symbol is a semicircle on a stick that can fit around the lollipop. This socket is a dependency or needed interface." [Component diagram. Wikipedia]
The example "Design elements - UML component diagrams" is included in the Rapid UML solution from the Software Development area of ConceptDraw Solution Park.
UML component diagram symbols
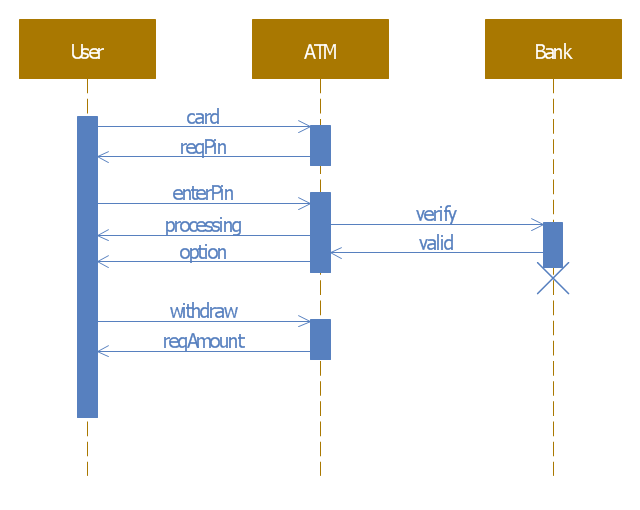
This example of automated teller machine (ATM) UML sequence diagram was created on the base of figure 5 "Sequence diagram" on the webpage "Message Sequence Charts and their Ilk" from the website of the University of California Irvine (UCI) Donald Bren School of Information and Computer Sciences.
"A UML sequence diagram or SD is similar to an MSC but written with a different notation. Presumably the same semantic issues arise, but possibly not since UML semantics are not well-defined. An example is shown in Figure 5.
The timelines are dotted rather than solid, and the name of the component is inside a box at the head of each timeline. The narrow rectangles apparently show when a component is active (unsure precisely what "active" means). An X on a timeline indicates that the component ceases to exist in some sense (unsure precisely how this is meant also). In the example, the Bank timeline has an X simply as an example (presumably the Bank does continue to exist)."
[www.ics.uci.edu/ ~alspaugh/ cls/ shr/ msc.html]
This example of bank ATM sequence diagram was created using the ConceptDraw PRO diagramming and vector drawing software extended with the ATM UML Diagrams solution from the Software Development area of ConceptDraw Solution Park.
Bank ATM UML sequence diagram
Entity Relationship Diagram Examples


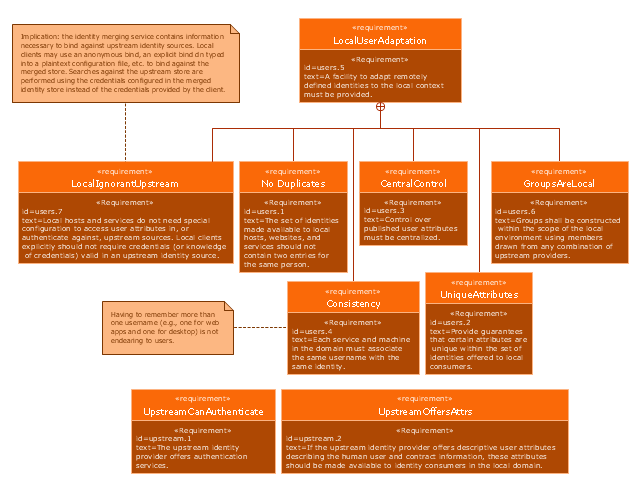
This example was created on the base of SysML requirements diagram in the webpage "V4/ Use Case for Views: Collaboration" from the FreeIPA website.
"This page describes a prototype implementation of a "merged domain" in a collaboration context. The hosting organization defined a collaboration environment outside it's security boundary: the network exists outside the organizational firewall, and corporate machines (i.e., Windows machines joined to the internal active directory domain) are not allowed to plug into the collaboration network. The collaboration environment is distinct from the internal corporate environment to such a degree that active directory is only leveraged for user authentication and basic user attributes (sn, givenName, mail, telephoneNumber). This basic information about corporate users was merged with external users defined and managed by FreeIPA. ...
Requirements for upstream identity providers as well as for "identity processing" once the identities enter the local domain are presented in the following SysML requirements diagram."
[freeipa.org/ page/ V4/ Use_ Case_ for_ Views:_ Collaboration]
The example "Identity requirements diagram" was drawn using the ConceptDraw PRO diagramming and vector drawing software extended with the SysML solution from the Software Development area of ConceptDraw Solution Park.
SysML requirements diagram
 Marketing Diagrams
Marketing Diagrams solution extends ConceptDraw PRO diagramming software with abundance of samples, templates and vector design elements intended for easy graphical visualization and drawing different types of Marketing diagrams and graphs, including Branding Strategies Diagram, Five Forces Model Diagram, Decision Tree Diagram, Puzzle Diagram, Step Diagram, Process Chart, Strategy Map, Funnel Diagram, Value Chain Diagram, Ladder of Customer Loyalty Diagram, Leaky Bucket Diagram, Promotional Mix Diagram, Service-Goods Continuum Diagram, Six Markets Model Diagram, Sources of Customer Satisfaction Diagram, etc. Analyze effectively the marketing activity of your company and apply the optimal marketing methods with ConceptDraw PRO software.
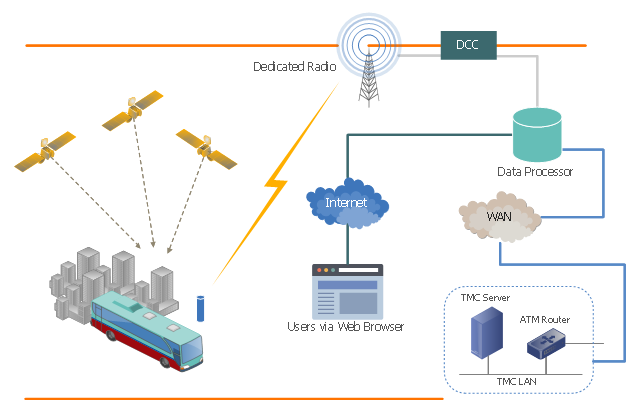
This vehicular network diagram sample shows the Intelligent Transportation System (ITS) from the California PATH (Partners for Advanced Transportation Technology) program. It was designed on the base of the diagram "California PATH Program Communications System" from the website of the Intelligent Transportations Systems Joint Program Office (ITS JPO), US Department of transportation.
"Communications systems, particularly MDTs (mobile data terminals), are often integrated with computer-aided dispatch and scheduling (CADS) systems by medium to large transit agencies. This combination allows dispatchers to make optimal changes to itineraries when necessary and to automatically communicate updated information to drivers. Communications systems can also be integrated with automatic vehicle location (AVL) systems to provide real-time location data with every communication exchange. This information can be transmitted in voice or text form." [pcb.its.dot.gov/ factsheets/ ct/ ct_ overview.aspx#page=common]
The vehicular network diagram example "California PATH Program Communications System" was created using the ConceptDraw PRO diagramming and vector drawing software extended with the Vehicular Networking solution from the Computer and Networks area of ConceptDraw Solution Park.
Vehicular network diagram
- Website launch - Flowchart | Website Process Flow Chart
- Web Page Component
- Block Diagrams | Website Wireframe | Example Block Diagram For ...
- Block Diagram Symbols Server Webpage Database
- Dfd For Website Design
- Website Wireframe | UML Component Diagram . Design Elements ...
- Website Wireframe | Timeline Diagrams | Business Process ...
- Website Er Diagram
- Web Site Flow Chart
- Website Database Flow Diagram