This site uses cookies. By continuing to browse the ConceptDraw site you are agreeing to our Use of Site Cookies.

WBS Diagram

Represent a set of planned outcomes that define 100% of the project scope. Create Work Breakdown Structure (WBS) diagram.

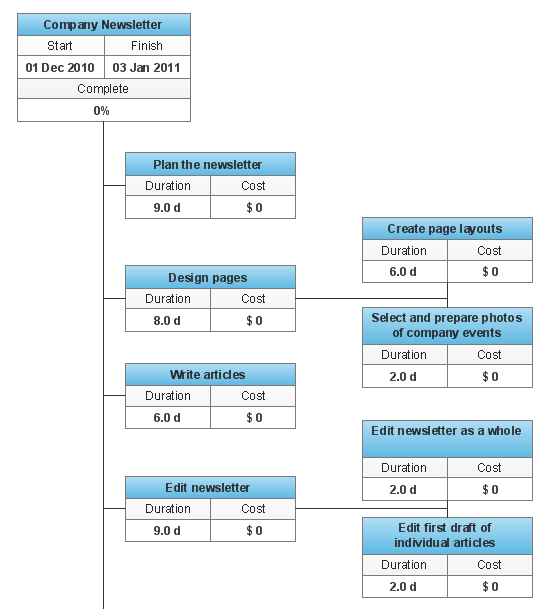
How to Report Task's Execution with Gantt Chart
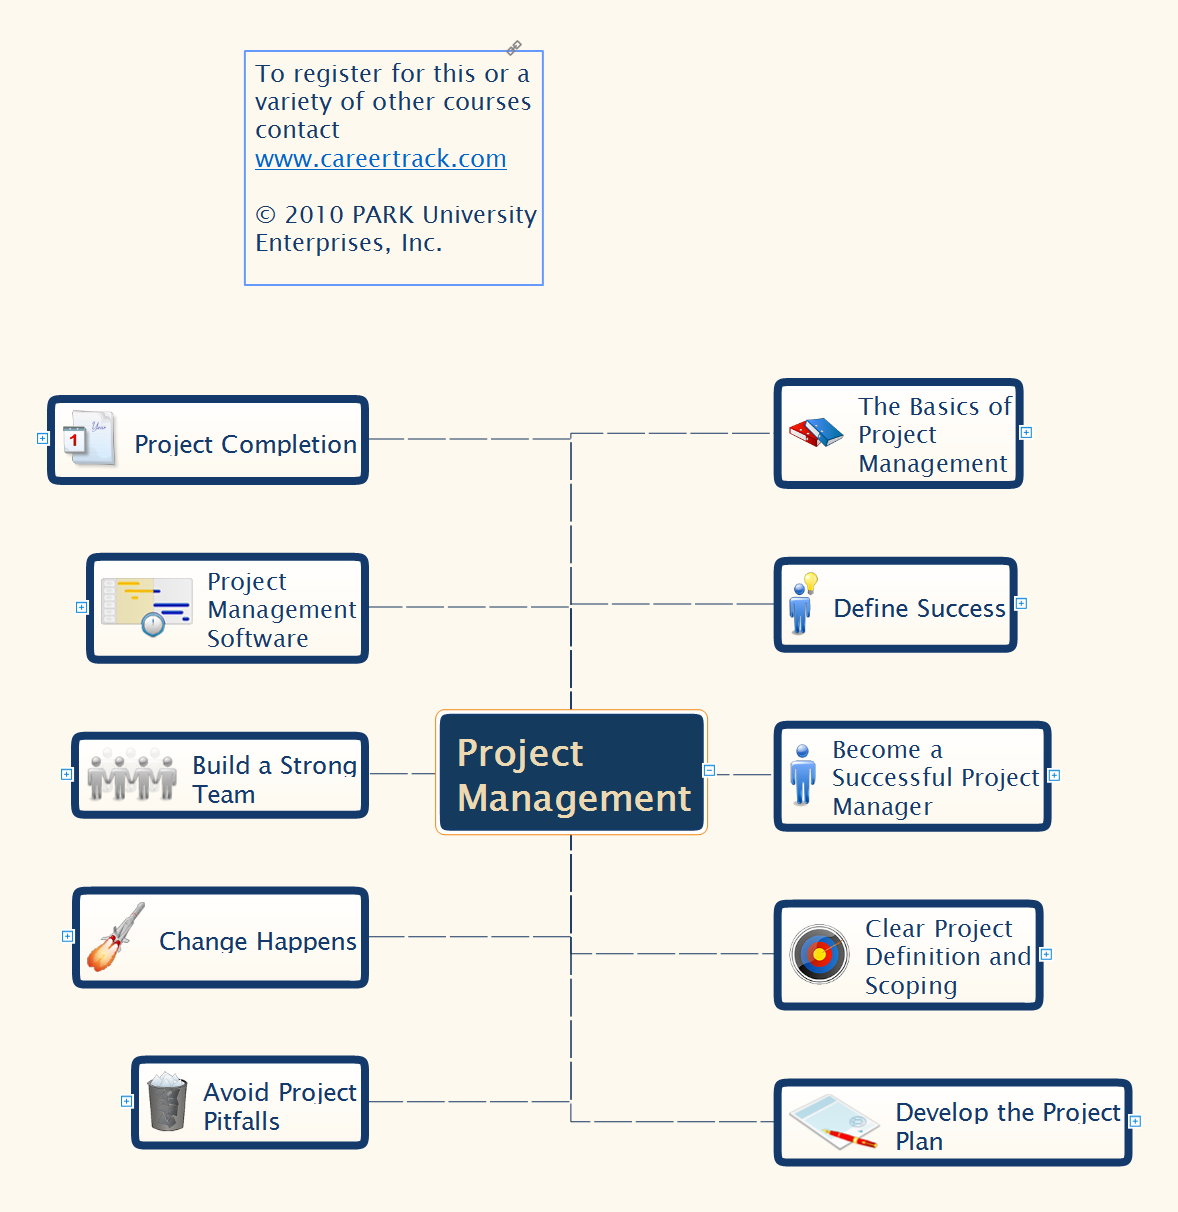
ConceptDraw PROJECT’s powerful reporting engine lets you generate a set of tabular reports with just one click, or visualize your project as Radial Tasks Structures, Work Breakdown Structures and Resource Calendars. It also provides you with dynamic Project Dashboards.

Org Chart Diagram

ConceptDraw Solution Park creates a single information space for messaging to teams. PM Teams provides project participants and organizations with better tools that assist in task understanding, timeframe understanding, and project events in the entire organization. Improved communication fosters positive team spirit throughout.

Project Management

A detailed mind map about the various elements and stages of project management.
HelpDesk

How to Create Project Diagrams on PC

Project diagrams give the ability to view at a detailed level project attributes such as project scope, logical connections in the project, critical paths, key events on the timeline, milestones, tasks, calendars for work, and resource utilization. Representing various project data in a visual form is a way to overview and represent project information to stakeholders. ConceptDraw PROJECT Reports allows creating 9 types of project diagrams that are generated in ConceptDraw DIAGRAM.