 Mathematics
Mathematics solution extends ConceptDraw PRO software with templates, samples and libraries of vector stencils for drawing the mathematical illustrations, diagrams and charts.
Mathematics Symbols

Mathematics solution provides 3 libraries with predesigned vector mathematics symbols and figures:
Solid Geometry Library, Plane Geometry Library and Trigonometric Functions Library.
How to Draw an Effective Workflow

Scientific Symbols Chart

Mathematics Solution from the Science and Education area of ConceptDraw Solution Park includes a few shape libraries of plane, solid geometric figures, trigonometrical functions and greek letters to help you create different professional looking mathematic illustrations for science and education.
Chemistry Symbols and Meanings

Copying Service Process Flowchart. Flowchart Examples

This sample shows the Flowchart on that it is displayed the process of the determination the permissibility according the Access Copyright license. The diamonds represent the decision points. Inside the diamonds are the questions that need the answer yes/no. It is necessary to answer on the question, make the decision that will determine the next step.
Solar System Symbols

To quickly draw any astronomy illustration: create new document and simply drag the needed solar system symbols from the Stars and Planets library, arrange them and add the text. You can also use the predesigned templates and samples from the ConceptDraw Solution Browser as the base for your own sun solar system illustrations, astronomy and astrology drawings.
Cisco WAN. Cisco icons, shapes, stencils and symbols
")
Basic Flowchart Images. Flowchart Examples

This sample shows the Flowchart that displays the procedures of 2PP (two-party preferred) voting and counting the voters. The two-party-preferred vote is the result of the elections that was distributed to the final two parties.
Chart Examples

Organic Chemistry Symbols

"In mathematics, the Euclidean algorithm, or Euclid's algorithm, is a method for computing the greatest common divisor (GCD) of two (usually positive) integers, also known as the greatest common factor (GCF) or highest common factor (HCF). ...
The GCD of two positive integers is the largest integer that divides both of them without leaving a remainder (the GCD of two integers in general is defined in a more subtle way).
In its simplest form, Euclid's algorithm starts with a pair of positive integers, and forms a new pair that consists of the smaller number and the difference between the larger and smaller numbers. The process repeats until the numbers in the pair are equal. That number then is the greatest common divisor of the original pair of integers.
The main principle is that the GCD does not change if the smaller number is subtracted from the larger number. ... Since the larger of the two numbers is reduced, repeating this process gives successively smaller numbers, so this repetition will necessarily stop sooner or later - when the numbers are equal (if the process is attempted once more, one of the numbers will become 0)." [Euclidean algorithm. Wikipedia]
The flowchart example "Euclidean algorithm" was created using the ConceptDraw PRO diagramming and vector drawing software extended with the Mathematics solution from the Science and Education area of ConceptDraw Solution Park.
Euclid's algorithm flow chart

"In elementary algebra, a quadratic equation (from the Latin quadratus for "square") is any equation having the form
ax^2+bx+c=0
where x represents an unknown, and a, b, and c are constants with a not equal to 0. If a = 0, then the equation is linear, not quadratic. The constants a, b, and c are called, respectively, the quadratic coefficient, the linear coefficient and the constant or free term.
Because the quadratic equation involves only one unknown, it is called "univariate". The quadratic equation only contains powers of x that are non-negative integers, and therefore it is a polynomial equation, and in particular it is a second degree polynomial equation since the greatest power is two.
Quadratic equations can be solved by a process known in American English as factoring and in other varieties of English as factorising, by completing the square, by using the quadratic formula, or by graphing." [Quadratic equation. Wikipedia]
The flowchart example "Solving quadratic equation algorithm" was created using the ConceptDraw PRO diagramming and vector drawing software extended with the Mathematics solution from the Science and Education area of ConceptDraw Solution Park.
Solving quadratic equation flow chart

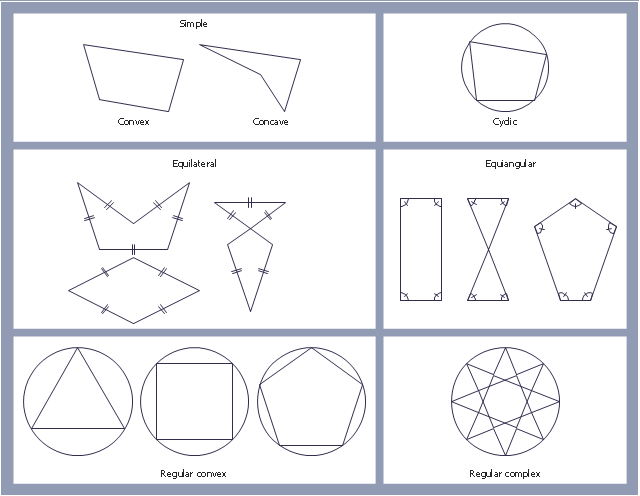
"In geometry a polygon is traditionally a plane figure that is bounded by a finite chain of straight line segments closing in a loop to form a closed chain or circuit. These segments are called its edges or sides, and the points where two edges meet are the polygon's vertices (singular: vertex) or corners. The interior of the polygon is sometimes called its body. An n-gon is a polygon with n sides. A polygon is a 2-dimensional example of the more general polytope in any number of dimensions. ...
The basic geometrical notion has been adapted in various ways to suit particular purposes. Mathematicians are often concerned only with the bounding closed polygonal chain and with simple polygons which do not self-intersect, and they often define a polygon accordingly. A polygonal boundary may be allowed to intersect itself, creating star polygons. Geometrically two edges meeting at a corner are required to form an angle that is not straight (180°); otherwise, the line segments may be considered parts of a single edge; however mathematically, such corners may sometimes be allowed. These and other generalizations of polygons are described below." [Polygon. Wikipedia]
The geometry diagram example "Polygon types" was created using the ConceptDraw PRO diagramming and vector drawing software extended with the Mathematics solution from the Science and Education area of ConceptDraw Solution Park.
Polygon types
- Mathematical Diagrams | Scientific Symbols Chart | Mathematics ...
- Mathematical Diagrams | Basic Diagramming | Mathematics ...
- Mathematics Symbols | Horizontal Flowchart | Mechanical Drawing ...
- Bar Diagram Math | Basic Diagramming | Mathematics Symbols ...
- Mathematics | Mathematics Symbols | Scientific Symbols Chart ...
- Math Topics Flow Chart Examples
- Basic Flowchart Symbols and Meaning | Euclidean algorithm ...
- Mathematics Symbols | Mathematical Diagrams | Basic ...
- Physics Diagrams | Education | Mathematical Diagrams ...
- Math Flow Chart Examples
- Bar Diagram Math | Basic Diagramming | Mathematics | Math Graph ...
- Types of Flowchart - Overview | Bar Diagram Math | Total Quality ...
- Mathematics Symbols | Basic Diagramming | Bar Diagram Math ...
- Basic Diagramming | Mathematical Diagrams | How to Draw ...
- Education | Mathematics Symbols | Mathematics | Math Vectors Mind ...
- Venn Diagram Math
- Butt weld geometry | Mathematics | Mathematical Diagrams ...
- Bar Diagram Math | Basic Diagramming | Mathematical Diagrams ...
- Basic Diagramming | Mathematics | Mathematical Diagrams ...
- Using Venn Diagrams In Math