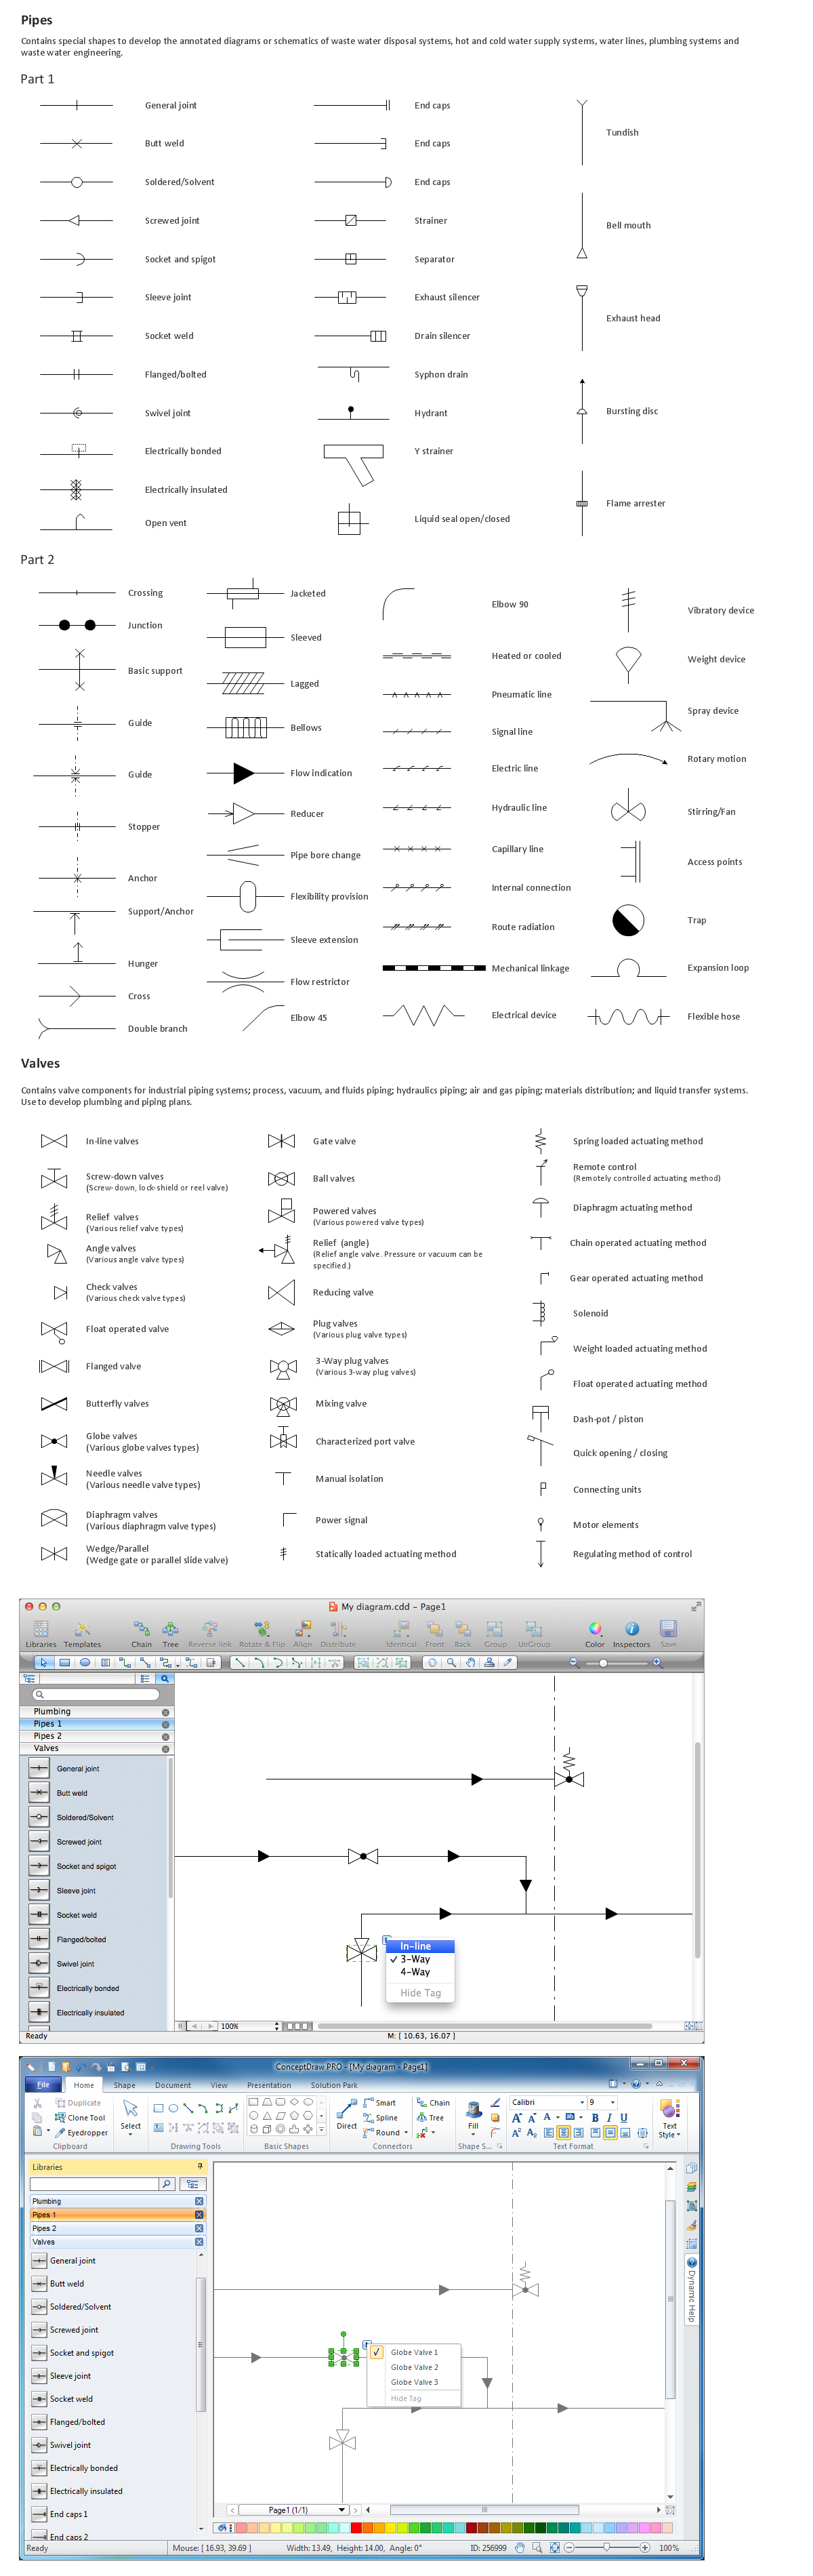
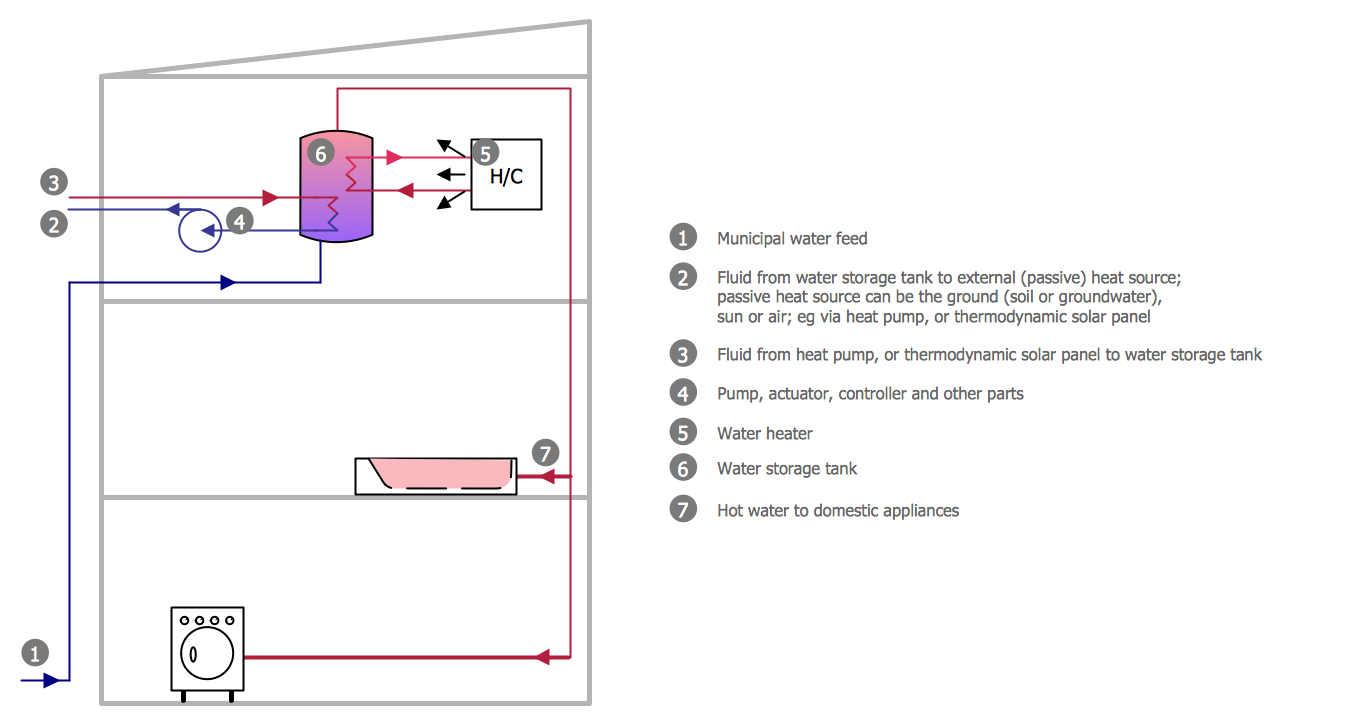
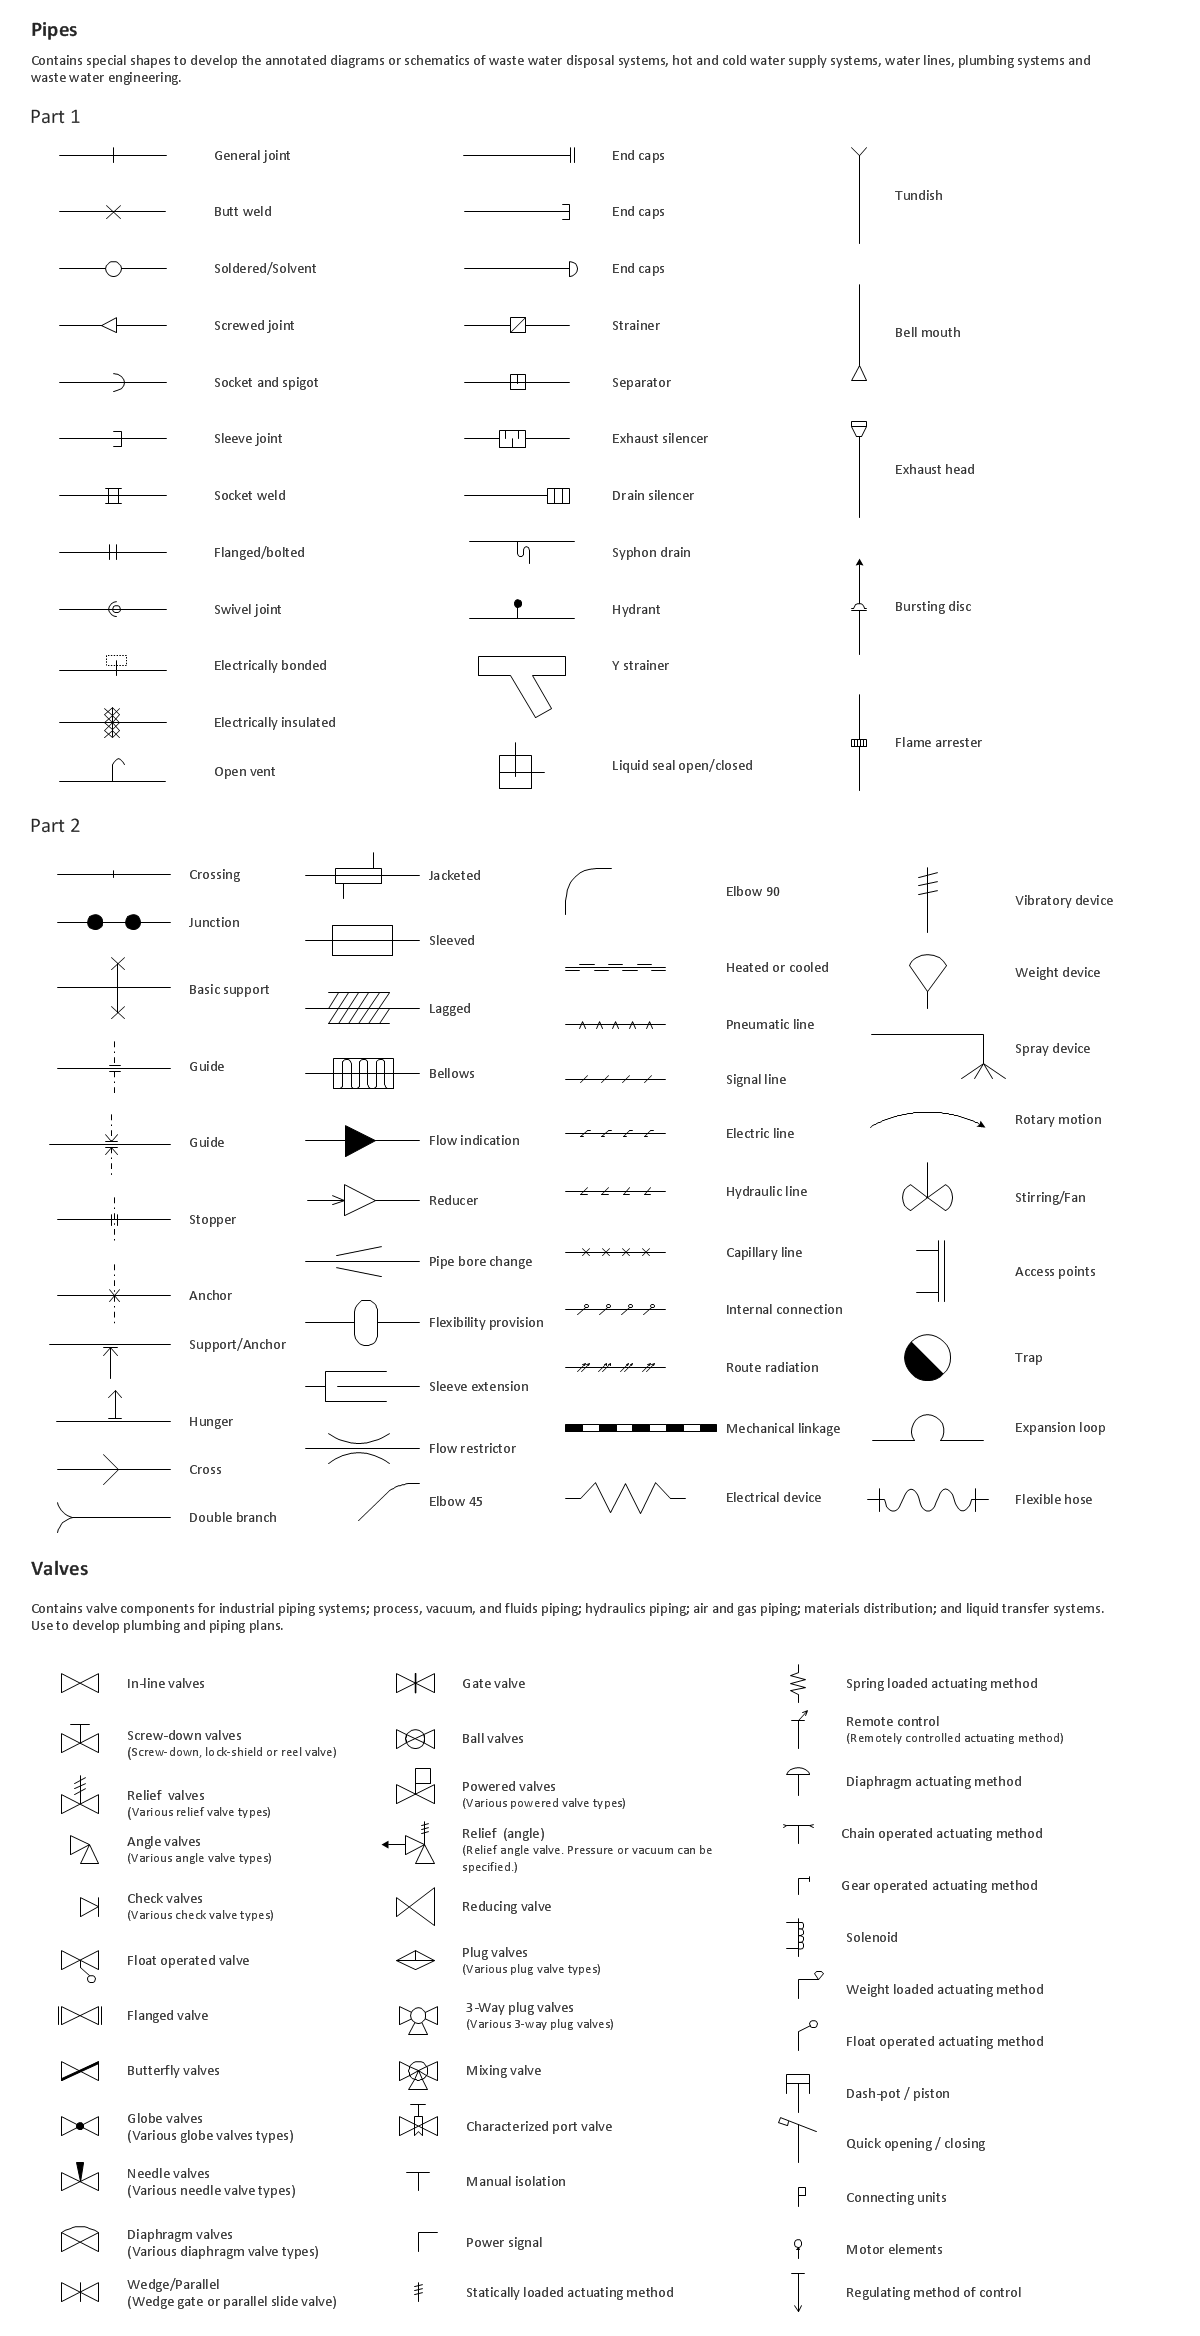
This site uses cookies. By continuing to browse the ConceptDraw site you are agreeing to our Use of Site Cookies.

Building Drawing Software for Design Piping Plan

Use building drawing software to develop the annotated diagrams or schematics of waste water disposal systems, hot and cold water supply systems, water lines and waste water engineering.

Building Drawing. Design Element: Piping Plan

Downloading conceptDraw unique product in order to make any of the plumbing plan, the annotated schematics or diagrams of waste water disposal systems seems to be making the right decision, especially knowing that it also allows you to draw not only plans, but many more other illustrations, such as different charts, flowcharts and diagrams.

Building Drawing. Design Element — Plumbing

Even if you never had any experience of making any similar plans, we can ensure you that using ConceptDraw DIAGRAM is possible to have a great looking result as if you were engineer in case you do not know much about engineering at all.

Piping and Instrumentation Diagram Software

ConceptDraw DIAGRAM is professional Piping and Instrumentation Diagram (P&ID) Software.
Plumbing and Piping Plans solution helps you create quick and easy: key piping and instrument details ,piping diagrams, instrumentation diagrams, schemes of hot and cold water supply systems, control and shutdown schemes, diagrams of plumbing systems, heating schemes, schematics of waste water disposal systems, safety and regulatory requirements, diagrams of ventilation systems, mechanical diagrams, industrial diagrams, basic start up and operational information.

Half Pipe Plans

Drawing of Half Pipe Plans is quite complex process. But now it's very to design the Half Pipe Plans of any complexity with ConceptDraw DIAGRAM diagramming and vector drawing software extended with Plumbing and Piping Plans Solution.

Process Flow Chart

A Process Flow Chart is a type of flowchart which is mostly used in industrial, chemical and process engineering for illustrating high-level processes, major plant processes and not shows minor details.
ConceptDraw DIAGRAM diagramming and vector drawing software extended with Flowcharts Solution from the "Diagrams" Area of ConceptDraw Solution Park is the best way to create Process Flow Chart and other types of flowcharts.

Flow chart Example. Warehouse Flowchart

Warehouse Flowcharts are different diagrams describing wharehousing and inventory menagement processes. Typical purposes of warehouse flowcharts are evaluating warehouse performance and organizational performance, measuring efficiency of customer service. This type of workflow diagrams can be used for identifying any disconnection between business activities and business objectives.
Standard warehousing process flow diagram and standard workflow diagram used for process identification for further evaluating effectiveness and profitability of overall business process. Use the ConceptDraw DIAGRAM diagramming and vector drawing software extended with the Flowcharts solution from the Diagrams area of ConceptDraw Solution Park to design your own workflow diagrams, process flow diagram and flow charts. Need to use Process Flow Diagram for designing Warehouse packages flow.
ConceptDraw Arrows10 Technology

Mechanical Drawing Symbols

Mechanical Engineering solution — 8 libraries are available with 602 commonly used mechanical drawing symbols in Mechanical Engineering Solution, including libraries called Bearings with 59 elements of roller and ball bearings, shafts, gears, hooks, springs, spindles and keys; Dimensioning and Tolerancing with 45 elements; Fluid Power Equipment containing 113 elements of motors, pumps, air compressors, meters, cylinders, actuators and gauges; Fluid Power Valves containing 93 elements of pneumatic and hydraulic valves (directional control valves, flow control valves, pressure control valves) and electrohydraulic and electropneumatic valves; as well as many other sophisticated symbols and templates for your use.

Draw Fishbone Diagram on MAC Software

There are many tools to facilitate the problem solving process. Cause and Effect diagram, or Fishbone diagram is one of them. Fishbone diagram can be constructed following 5 simple steps.
Professional diagramming ConceptDraw DIAGRAM MAC OSX software with Fishbone Diagrams solution helps you make cause and effect analysis, identify the possible causes for an effect for problem solving, draw Fishbone diagram on Mac software aka Ishikawa diagram from brainstorm, templates and examples.

Bubble diagrams with ConceptDraw DIAGRAM

Using ConceptDraw you will be able to create bubble diagrams from the ready ConceptDraw library objects or make your own objects. The created diagram can be saved and edited, objects can be moved and links between them will be automatically repainted after object moving because of using the ConceptDraw connectors.