3 Circle Venn. Venn Diagram Example

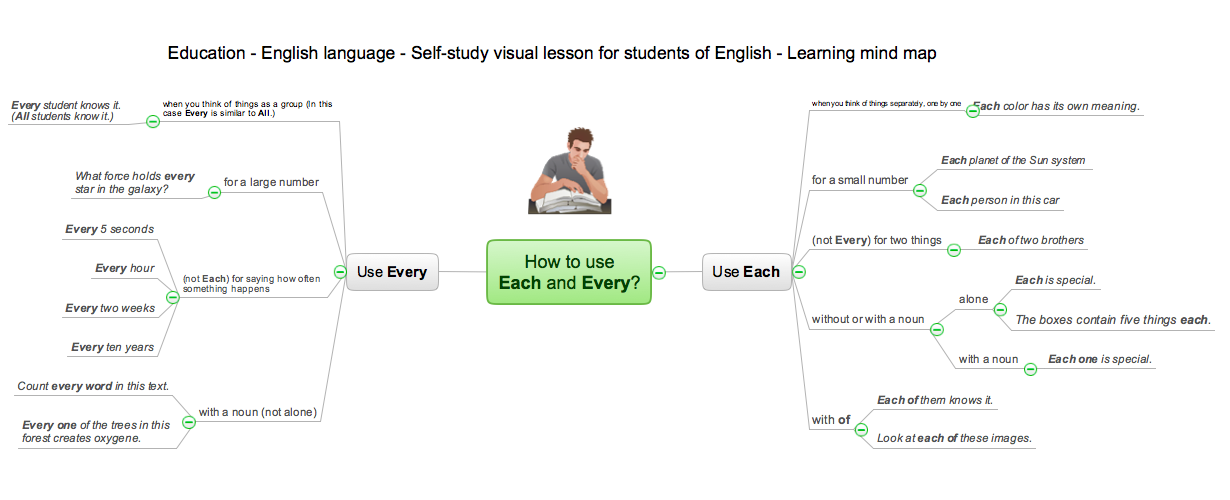
Language School E-Learning

 Azure Architecture
Azure Architecture solution bundles into one handy tool everything you need to create effective Azure Architecture diagrams. It adds the extra value to versatile ConceptDraw DIAGRAM software and extends the users capabilities with comprehensive collection of Microsoft Azure themed graphics, logos, preset templates, wide array of predesigned vector symbols that covers the subjects such as Azure management, Azure storage, and Azure services, amongst others, and allow you to illustrate Azure Architecture diagrams at any degree of complexity, to present visually your Azure cloud system architecture with professional style, to design Azure cloud topology, to document Windows Azure Architecture and Azure Cloud System Architecture, to visualize the great abilities and work of Microsoft Azure Cloud System and Azure services.
Basic Diagramming


 Stakeholder Onion Diagrams
The Stakeholder Onion Diagram is often used as a way to view the relationships of stakeholders to a project goal. A basic Onion Diagram contains a rich information. It shows significance of stakeholders that will have has influence to the success achieve
 Project Management Area
Project Management area provides Toolbox solutions to support solving issues related to planning, tracking, milestones, events, resource usage, and other typical project management functions.
HelpDesk
How to Make a Garden Design

 Specification and Description Language (SDL)
For people in the field of systems engineering or system design, working with specification and description language (sdl) and finite state machines (fsm).
 Rapid UML
Rapid UML solution extends ConceptDraw DIAGRAM software with templates, samples and libraries of vector stencils for quick drawing the UML diagrams using Rapid Draw technology.
 Circle-Spoke Diagrams
Examples of subject areas that are well suited to this approach are marketing, business, products promotion, process modeling, market, resource, time, and cost analysis. Circle-Spoke Diagrams are successfully used in presentations, conferences, management documents, magazines, reportages, reviews, reports, TV, and social media.
Basic Diagramming

Total Quality Management with ConceptDraw

 SWOT and TOWS Matrix Diagrams
SWOT and TOWS Matrix Diagrams solution extends ConceptDraw DIAGRAM and ConceptDraw MINDMAP software with features, templates, samples and libraries of vector stencils for drawing SWOT and TOWS analysis matrices and mind maps.
 Block Diagrams
Block diagrams solution extends ConceptDraw DIAGRAM software with templates, samples and libraries of vector stencils for drawing the block diagrams.
Block Diagram

- Venn Diagram Examples for Problem Solving. Environmental Social ...
- Venn Diagram Examples for Problem Solving. Environmental Social ...
- Simple Drawing Applications for Mac | Venn Diagram Examples for ...
- Venn Diagram Examples for Problem Solving. Environmental Social ...
- Venn Diagram Examples for Problem Solving. Environmental Social ...
- Draw The Diagram Of Business Environment
- Simple Drawing Applications for Mac | Venn Diagram Examples for ...
- Venn Diagram Examples for Problem Solving. Environmental Social ...
- Steps To Draw Diagram Of Environment
- Map Or Drawing And Diagram Of Environment
- Venn Diagram Examples for Problem Solving. Environmental Social
- Draw Fishbone Diagram on MAC Software | Simple Drawing ...
- Basic Audit Flowchart. Flowchart Examples | Venn Diagram ...
- Draw The Diagram Of Market Environment
- Dwaring Chart Of Environment
- Process Flowchart | Simple Drawing Applications for Mac | Venn ...
- Draw The Block Diagram Of Hrm Environment
- Percentage Pie Chart. Pie Chart Examples | Venn Diagram ...
- Simple Drawing Applications for Mac | Process Flowchart | Venn ...
- Venn Diagram Examples for Problem Solving. Environmental Social ...