Flowchart design. Flowchart symbols, shapes, stencils and icons


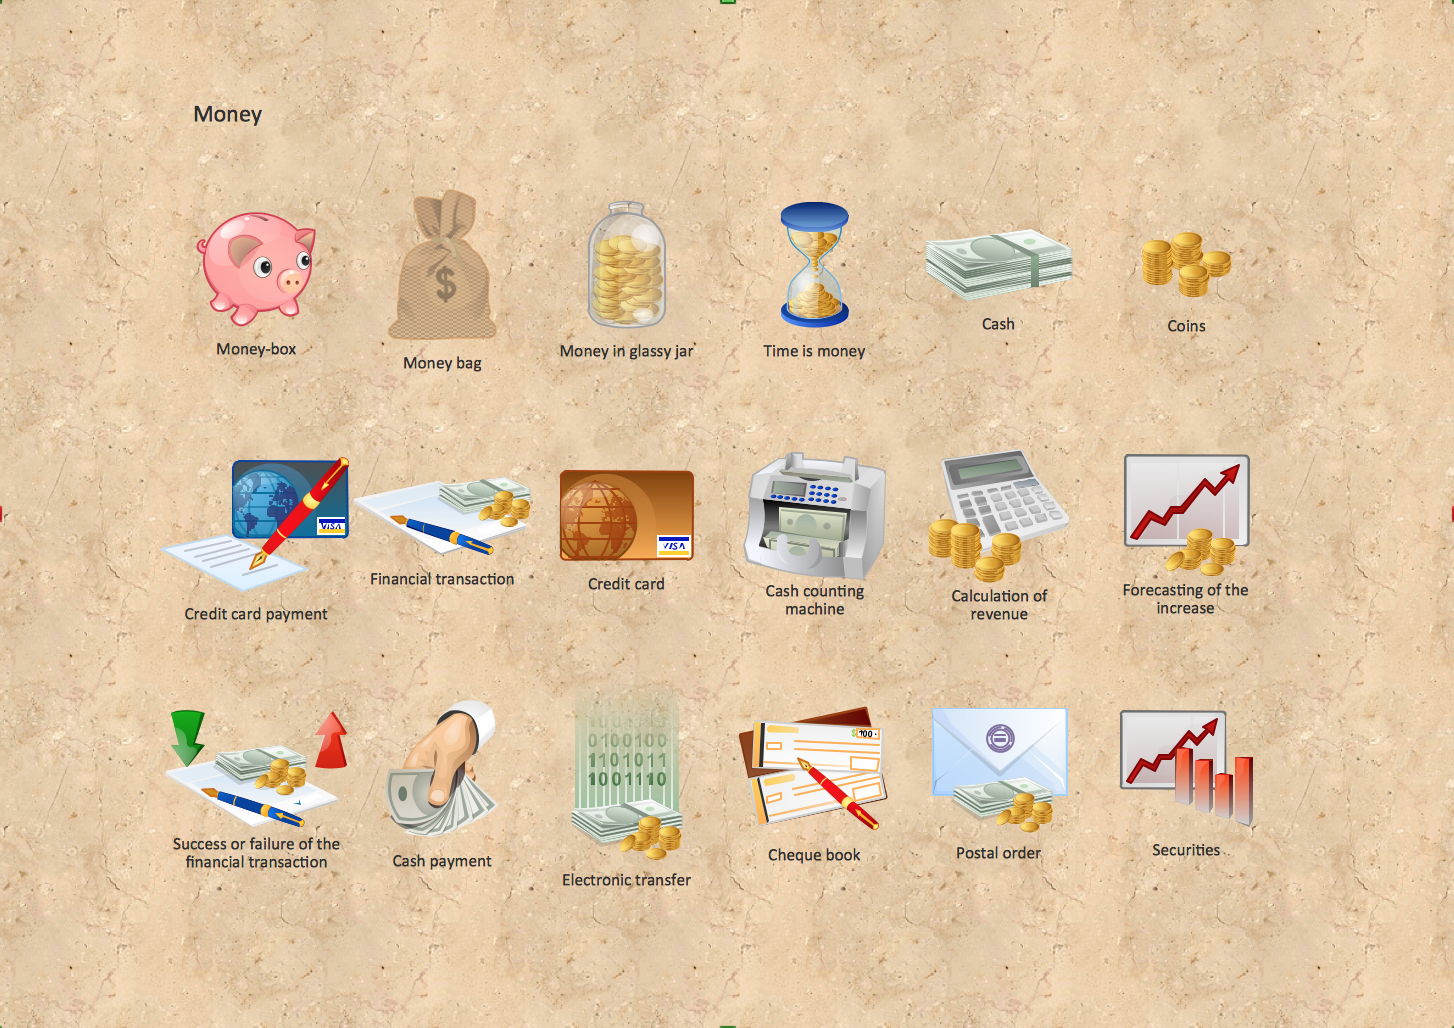
The vector stencils library "Currency" contains 28 currency and money icons.
Use it to design your business and finance illustrations and infographics with ConceptDraw PRO diagramming and vector drawing software.
The vector stencils library "Currency" is included in the Business and Finance solution from the Illustration area of ConceptDraw Solution Park.
Use it to design your business and finance illustrations and infographics with ConceptDraw PRO diagramming and vector drawing software.
The vector stencils library "Currency" is included in the Business and Finance solution from the Illustration area of ConceptDraw Solution Park.
Dollar

Euro

Pound

Yen

Dollar banknotes

Euro banknotes

Pound banknotes

Yen banknotes

Coins

Money bags

Money in jar

Credit cards

Money box

Financial transaction

Calculation

Budget measures

Financial growth

Cash register finance calculation

Electronic funds

Credit card payment

Cash payment

Donation

Cheque book

Invoice

Money management

Time is money

Estimate

Financial security

The vector stencils library "Finance" contains 16 finance icons.
Use it to design your financial computing and telecom illustrations and infographics with ConceptDraw PRO diagramming and vector drawing software.
The vector stencils library "Finance" is included in the Computers and Communications solution from the Illustration area of ConceptDraw Solution Park.
Use it to design your financial computing and telecom illustrations and infographics with ConceptDraw PRO diagramming and vector drawing software.
The vector stencils library "Finance" is included in the Computers and Communications solution from the Illustration area of ConceptDraw Solution Park.
Growth chart

Currency

Credit cards

Finance planning

Funds

Bank storage

Safe box

Bank

Transaction

Accounting

Send money

Receive money

Wallet

Marketplace

Case

Award

UML Deployment Diagram Example - ATM System UML diagrams

Winter Sports Vector Clipart. Medal Map. Spatial Infographics

Money - Design Elements
UML Deployment Diagram

UML Use Case Diagram Example. Services UML Diagram. ATM system

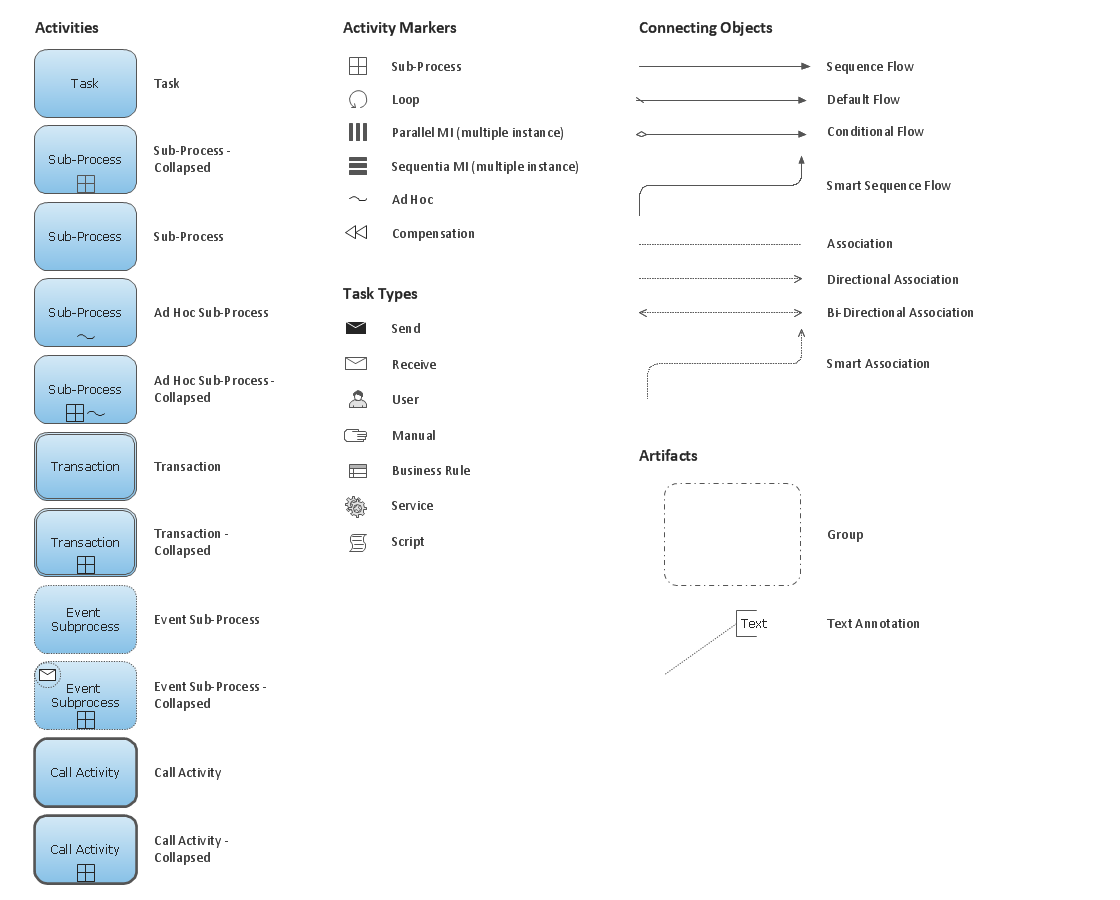
Business Process Elements: Activities

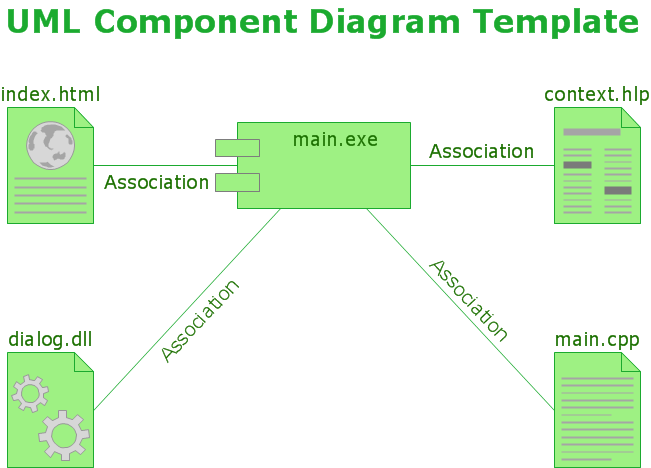
UML Component Diagram
- Bank Transactions Vector
- Sales workflow - Vector stencils library | Rapid UML | Business ...
- Sales workflow - Vector stencils library | Flowcharts | Generate ...
- Cheque Vector Png
- UML deployment diagram - Real estate transactions | Road ...
- Finance - Vector stencils library | Business People Clipart | Business ...
- Currency - Vector stencils library | Currency - Vector stencils library ...
- Transaction
- Finance - Vector stencils library | Currency - Vector stencils library ...
- Activities BPMN 1.2 - Vector stencils library | Activities BPMN 1.2 ...