Drawing Illustration

How to Draw an Organization Chart

Export from ConceptDraw DIAGRAM Document to a Graphic File


HelpDesk
How To Create a CRM System Dashboard

Entity Relationship Diagram Software

 Presentation Clipart
Presentation design elements solution extends ConceptDraw DIAGRAM software with slide samples, templates and vector stencils libraries with design elements of presentation symbols, arrows, callouts, backgrounds, borders and frames, title blocks.
Flowchart design. Flowchart symbols, shapes, stencils and icons


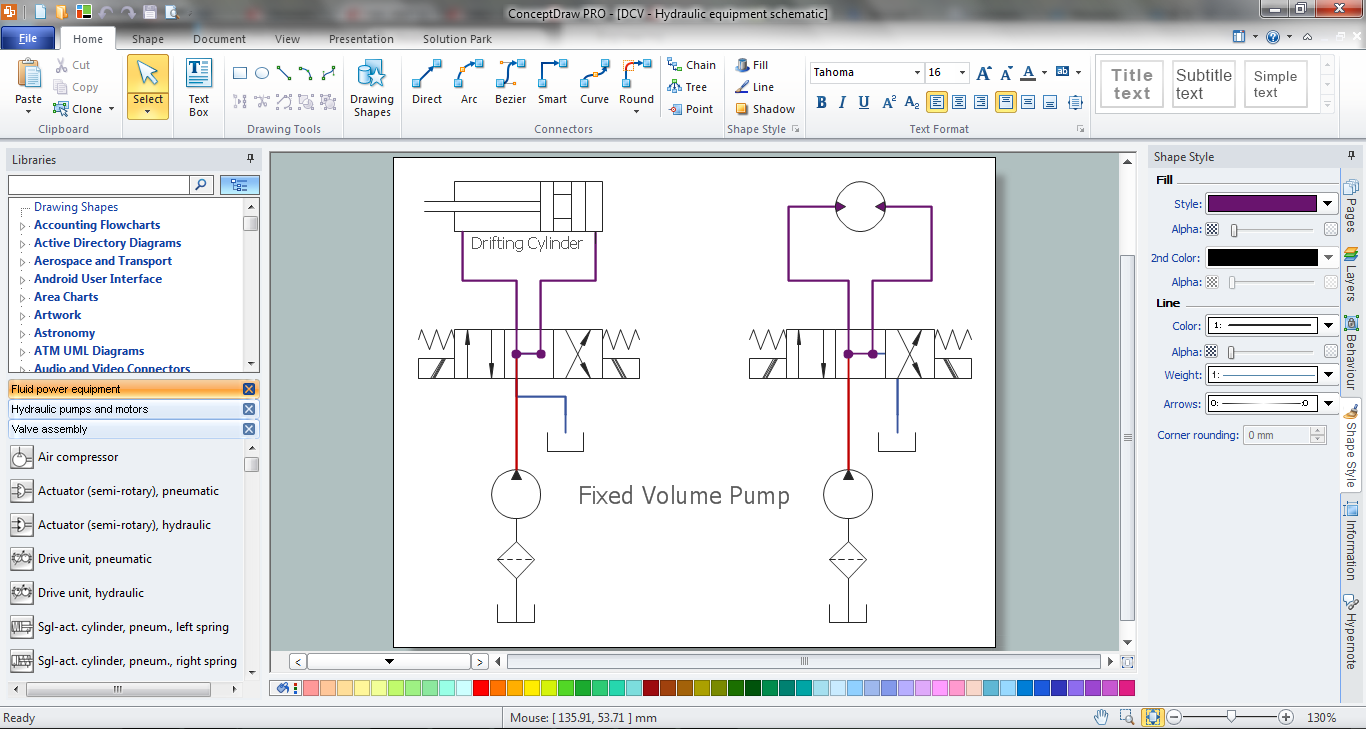
Mechanical Design Software
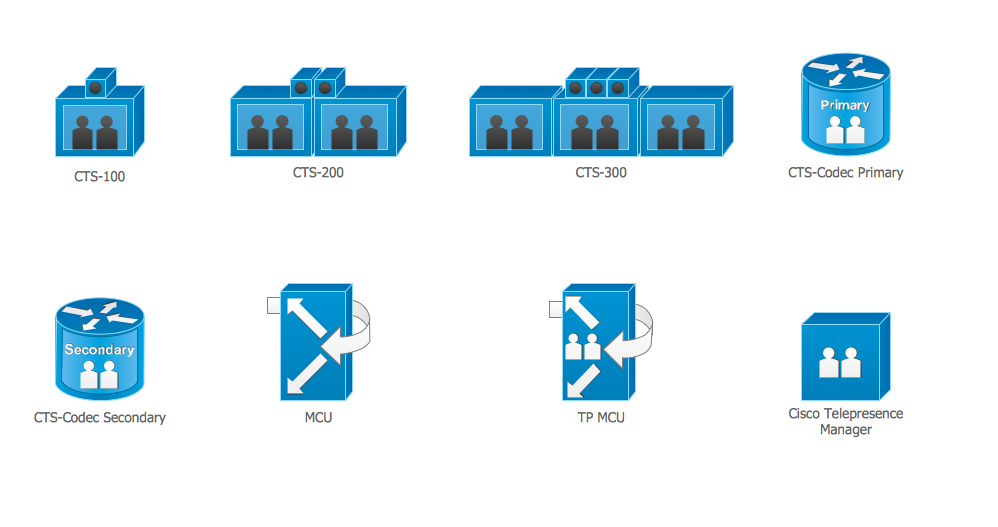
Cisco Telepresence. Cisco icons, shapes, stencils and symbols
Venn Diagram
