 Value Stream Mapping
Value stream mapping solution extends ConceptDraw PRO software with templates, samples and vector stencils for drawing the Value Stream Maps (VSM) in lean manufacturing practice.
Best Value Stream Mapping mac Software
 diagram")
"Value stream mapping is a lean management principle used to analyze and design the flow of materials and information required to bring a product or service to a consumer. Pioneered by Henry Ford in the 1920s, perfected by Toyota. At Toyota, it is known as "material and information flow mapping". It can be applied to nearly any value chain. ...
Value stream mapping has supporting methods that are often used in Lean environments to analyze and design flows at the system level (across multiple processes).
Although value stream mapping is often associated with manufacturing, it is also used in logistics, supply chain, service related industries, healthcare, software development, product development, and administrative and office processes." [Value stream mapping. Wikipedia]
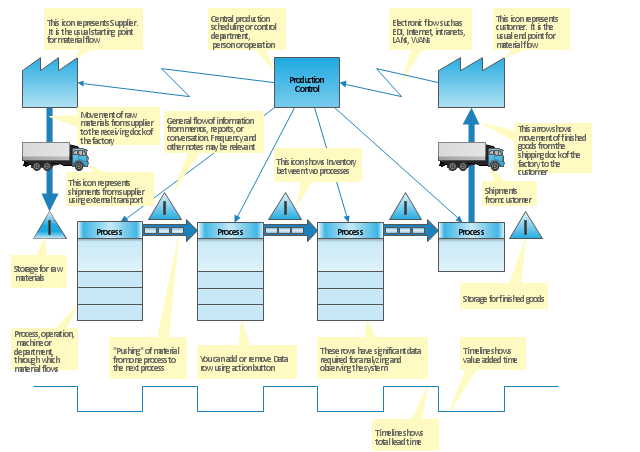
This value stream map template explains the meanings of the VSM design elements.
This Value stream map template for the ConceptDraw PRO diagramming and vector drawing software is included in the Value Stream Mapping solution from the Quality area of ConceptDraw Solution Park.
Value stream mapping has supporting methods that are often used in Lean environments to analyze and design flows at the system level (across multiple processes).
Although value stream mapping is often associated with manufacturing, it is also used in logistics, supply chain, service related industries, healthcare, software development, product development, and administrative and office processes." [Value stream mapping. Wikipedia]
This value stream map template explains the meanings of the VSM design elements.
This Value stream map template for the ConceptDraw PRO diagramming and vector drawing software is included in the Value Stream Mapping solution from the Quality area of ConceptDraw Solution Park.
VSM template
Types of Flowcharts


Stakeholder Mapping Tool

 Healthcare Management Workflow Diagrams
Healthcare Management Workflow Diagrams solution contains large set of colorful samples and libraries with predesigned vector pictograms and symbols of health, healthcare equipment, medical instruments, pharmaceutical tools, transport, medication, departments of healthcare organizations, the medical icons of people and human anatomy, as well as the predesigned flowchart objects, connectors and arrows, which make it the best for designing clear and comprehensive Mediсal Workflow Diagrams and Block Diagrams, Healthcare Management Flowcharts and Infographics, Healthcare Workflow Diagram, for depicting the healthcare workflow and clinical workflows in healthcare, for making the workflow analysis healthcare and healthcare workflow management.
State Diagram Example - Online Store

Relationships Analysis


- Healthcare Management Workflow Diagrams | Pharmacy ...
- Aerospace and Transport | Value Stream Mapping | Manufacturing ...
- Value stream map - Template
- Value stream map - Template | Design elements - Value stream ...
- VSM Template
- Logistics and Supply Chain Dashboard - Template | Value stream ...
- Value stream map - Template | How to Create a VSM Diagram Using ...
- Event-driven Process Chain (EPC) Diagrams | Value stream map ...
- Prioritization matrix - Health care problems | Health Sector ...
- Value stream map - Template | Advanced persistent threat lifecycle ...