The vector clipart library "Presentation" design elements contains 45 symbols you can use to design your presentation slides and illustrations using the ConceptDraw PRO diagramming and vector drawing software.
"Although some think of presentations in a business meeting context, there are often occasions when that is not the case. For example, a non-profit organization presents the need for a capital fund-raising campaign to benefit the victims of a recent tragedy; a school district superintendent presents a program to parents about the introduction of foreign-language instruction in the elementary schools;an artist demonstrates decorative painting techniques to a group of interior designers; a horticulturist shows garden club members or homeowners how they might use native plants in the suburban landscape; a police officer addresses a neighborhood association about initiating a safety program. ...
A study done by Wharton School Of Business showed that the use of visuals reduced meeting times by 28 percent. Another study found that audiences believe presenters who use visuals are more professional and credible than presenters who merely speak. Other research indicates that meetings and presentations reinforced with visuals help participants reach decisions and consensus more quickly." [Presentation. Wikipedia]
The clip art example "Design elements - Presentation symbols" is included in the Presentation Clipart solution from the Illustration area of ConceptDraw Solution Park.
Presentation clip art and pictograms
Presenting Documents with Remote Presentation for Skype Solution

 Transport Hazard Pictograms
Transport Hazard Pictograms solution includes large variety of specially developed samples with transport hazard symbols and pictograms, and the whole set of predesigned vector transport GHS pictograms download and used with ease from the Transport Hazard Pictograms library. Apply them for quick designing professional-looking infographics and diagrams, use them to create warning signboards and announcements on all stages of the transportation process, to place them on the transport vehicles and warehouses of transportation companies, at the transport documentation and on the websites of transport and logistics companies.
Export from ConceptDraw MINDMAP to PowerPoint® Presentation


to MS PowerPoint
The vector clipart library "Arrows" contains 37 arrows you can use to design your presentation slides and illustrations using the ConceptDraw PRO diagramming and vector drawing software.
"An arrow is a graphical symbol ... used to point or indicate direction, being in its simplest form a line segment with a triangle affixed to one end, and in more complex forms a representation of an actual arrow... The direction indicated by an arrow is the one along the length of the line towards the end capped by a triangle. Arrows are also used, in some cultures, as a sign of danger, depending on the direction the arrow is pointing." [Arrow (symbol). Wikipedia]
The example "Design elements - Arrows" is included in the Presentation Clipart solution from the Illustration area of ConceptDraw Solution Park.
Arrow clip art and pictograms
The vector stencils library "Travel and tourism pictograms" contains 20 travel and tourism pictograms.
Use it to create your infographics, illustrations and presentations.
The pictogram example "Design elements - Travel and tourism pictograms" was created using the ConceptDraw PRO diagramming and vector drawing software extended with the Pictorial infographics solution from the area "What is infographics" in ConceptDraw Solution Park.
Pictograms

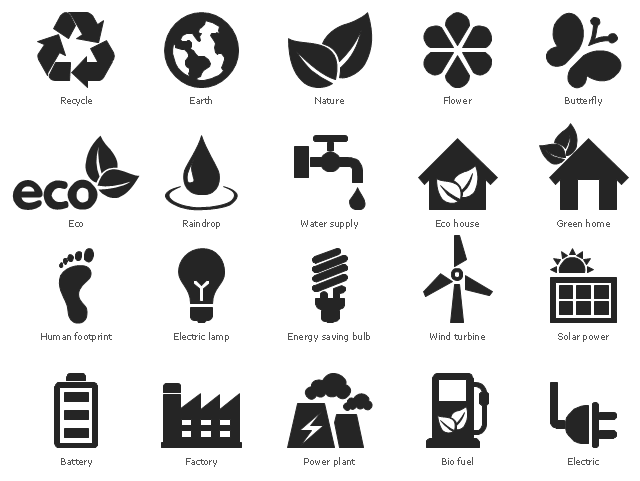
The vector stencils library "Ecology pictograms" contains 20 ecological pictograms.
Use it to draw your eco illustrations, presentations, web pages and infographics.
The example "Design elements - Ecology pictograms" was created using the ConceptDraw PRO diagramming and vector drawing software extended with the Pictorial Infographic solution from the area "What is infographics" in ConceptDraw Solution Park.
Eco pictograms
HelpDesk
How to Design Effective Medical Illustrations

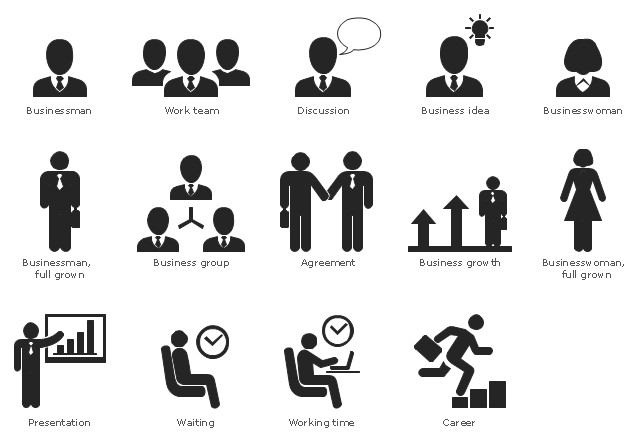
The vector stencils library "Business people pictograms" contains 14 icons of business people.
Use it to draw your pictorial infographics.
The example "Business people pictograms - Vector stencils library" was created using the ConceptDraw PRO diagramming and vector drawing software extended with the Pictorial infographics solution from the area "What is infographics" in ConceptDraw Solution Park.
Businessman

Businesswoman

Businessman, full grown

Businesswoman, full grown

Business group

Work team

Presentation

Waiting

Working time

Discussion

Business idea

Agreement

Career

Business growth

Business Process

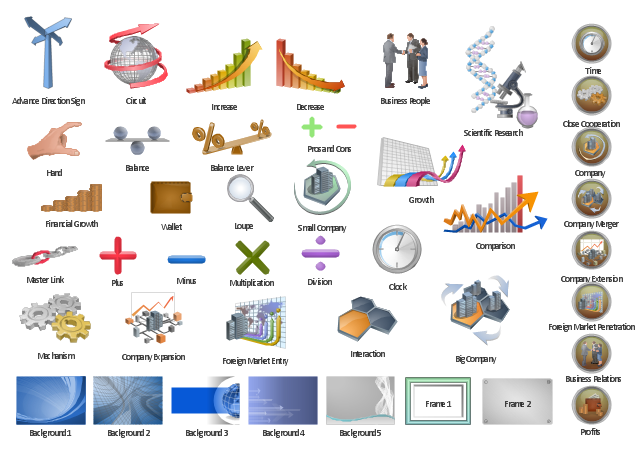
The vector clipart library "Presentation design elements" contains 45 presentation symbols and arrows which you can easy use in your slides and illustrations.
"A presentation is the process of presenting a topic to an audience. It is typically a demonstration, lecture, or speech meant to inform, persuade, or build good will. ... the use of visuals reduced meeting times... audiences believe presenters who use visuals are more professional and credible than presenters who merely speak. ... meetings and presentations reinforced with visuals help participants reach decisions and consensus more quickly." [Presentation. Wikipedia]
The clip art example "Presentation design elements - Vector clipart library" was created in the ConceptDraw PRO diagramming and vector drawing software using the Presentation Clipart solution from the Illustration area of ConceptDraw Solution Park.
Advance Direction Sign

Circuit

Growth

Master Link

Comparison

Plus

Minus

Multiplication

Division

Loupe

Plus sign

Minus sign

Pros and Cons

Balance Lever

Balance

Scientific Research

Business People

Hand

Financial Growth

Wallet

Increase

Decrease

Clock

Mechanism

Interaction

Small Company

Big Company

Company Expansion

Foreign Market Entry

Time

Close Cooperation

Company

Company Merger

Company Extension

Foreign Market Penetration

Business Relations

Profits

Frame 1

Frame 2

Background 1

Background 2

Background 3

Background 4

Background 5

Title block

How To create Diagrams for Amazon Web Services architecture

The vector stencils library "Soccer pictograms" contains 27 association football pictograms clipart.
Use these shapes for designing your sport infographics, webpages, illustrations and presentations in the ConceptDraw PRO diagramming and vector drawing software extended with the Soccer solution from the Sport area of ConceptDraw Solution Park.
www.conceptdraw.com/ solution-park/ sport-soccer
Use these shapes for designing your sport infographics, webpages, illustrations and presentations in the ConceptDraw PRO diagramming and vector drawing software extended with the Soccer solution from the Sport area of ConceptDraw Solution Park.
www.conceptdraw.com/ solution-park/ sport-soccer
Footballer

Footballer

Footballer

Footballer

Footballer

Footballer

Goalkeeper

Goalkeeper

Goalkeeper

Referee

Referee

Referee

Soccer field
Whistle

Football ball

Football sneakers

Goal
Gate
Champion cup

Score

Referee shirt

Footballer shirt

Soccer referee flag

Soccer referee flag

Soccer referee flag

Soccer uniform
Stopwatch

The vector stencils library "Business people pictograms" contains 14 business people pictograms.
Use it to draw your infographics.
The example "Design elements - Business people pictograms" was created using the ConceptDraw PRO diagramming and vector drawing software extended with the Pictorial Infographic solution from the area "What is infographics" in ConceptDraw Solution Park.
Use it to draw your infographics.
The example "Design elements - Business people pictograms" was created using the ConceptDraw PRO diagramming and vector drawing software extended with the Pictorial Infographic solution from the area "What is infographics" in ConceptDraw Solution Park.
Pictograms
 Quality Mind Map
In order to create any needed mind map, the ConceptDraw DIAGRAM diagramming and drawing software can be used. The Quality Mind Map solution provides the pre-made quality mind map templates, samples and stencil libraries full of design elements. Having such great starting points for identifying, tracking and addressing all the quality initiatives in your organization, you can start using the Quality Mind Map solution right now editing the existing examples and so creating the unique and good-looking drawings. It is useful for a wide range of business specialists, analysts, project managers, creative managers, project members, marketers, teachers and many other specialties.
 Customer Journey Mapping
Customer Journey Mapping Solution for ConceptDraw DIAGRAM opens incredibly broad opportunities for marketing and business specialists, product managers, designers, engineers, and other people interested in business development, increasing the product’s audience, its success and users' demand, providing them with capabilities of customer journey mapping. The included diagramming and customer journey mapping tools, predesigned vector customer journey mapping icons and charts, consumer journey mapping connectors, user journey and customer mapping figures, customer experience map icons and touchpoint icons, quick-start templates and samples provide excellent conditions for the customer journey mapping process, for creating Customer Journey Map and Customer Experience Map.
 Health Package
Health Package is a set of multifaceted solutions intended for visualization and illustration in a field of medicine and health, for drawing colorful, interesting and precise illustrations and infographics that will be used successfully in medical documents, articles, special magazines, posters, billboards, websites, presentations, collages. Having these solutions available, it will not be difficult to illustrate the medical editions, to convey the information in a full and interesting form, to teach students with use effective visual methods, to describe the medical facts, to tell about innovations in a field of medicine, health and correct nutrition, to explain the causes and consequences of different diseases, as well as the measures of their prevention and treatment.
Oil and Gas Symbols

- Design elements - Presentation symbols | Business people pictograms
- Presentation Clipart | Business People Clipart | How to Create a ...
- Transport Hazard Pictograms | Presentation Pictogram
- Presentation design elements - Vector clipart library | Design ...
- Design elements - Presentation symbols | Event-driven Process ...
- Presentation design elements - Vector clipart library | Business ...
- Design elements - Scrum people
- Elements location of a welding symbol - Presentation symbols
- Export from ConceptDraw PRO Document to a Graphic File | People
- Presentation design elements - Vector clipart library | Management ...