 Pie Charts
Pie Charts are extensively used in statistics and business for explaining data and work results, in mass media for comparison (i.e. to visualize the percentage for the parts of one total), and in many other fields. The Pie Charts solution for ConceptDraw DIAGRAM offers powerful drawing tools, varied templates, samples, and a library of vector stencils for simple construction and design of Pie Charts, Donut Chart, and Pie Graph Worksheets.
 USA Maps
Use the USA Maps solution to create a map of USA, a US interstate map, printable US maps, US maps with cities and US maps with capitals. Create a complete USA states map.
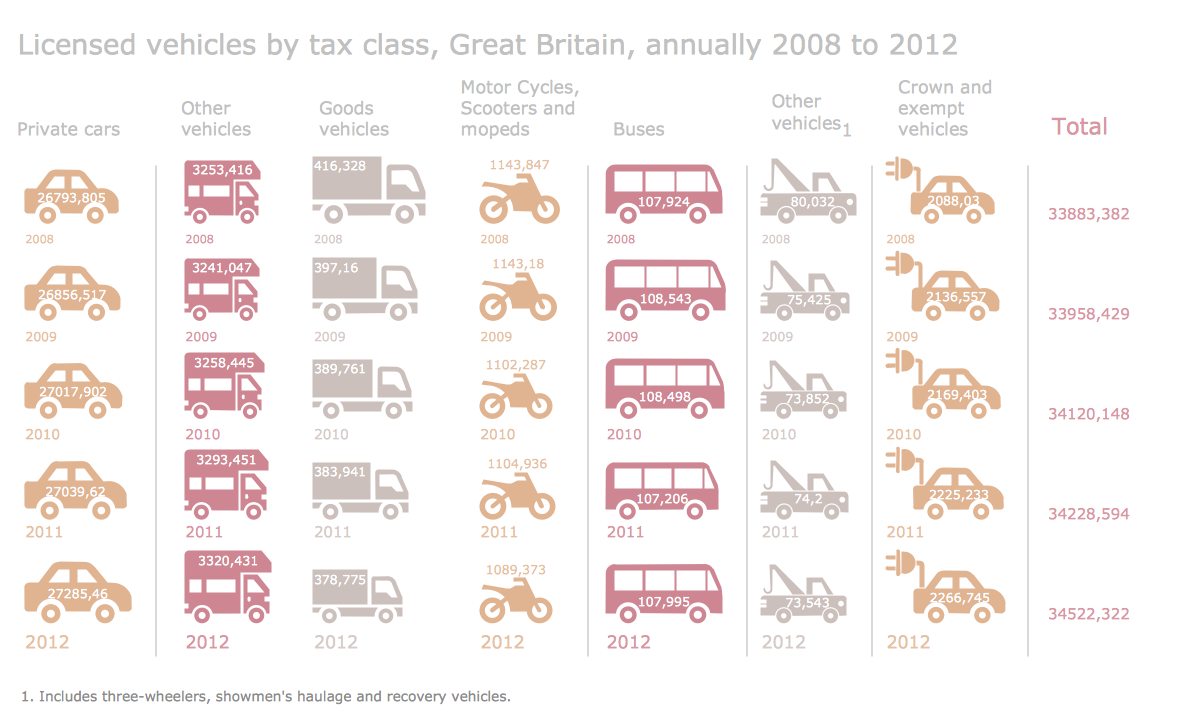
Sample Pictorial Chart. Sample Infographics

Information Graphics
 Business Diagrams Package
Business Diagrams Package is a large set of comprehensive graphical solutions from the ConceptDraw Solution Park, which are powerful in solving the business, marketing and quality tasks in completely different fields, such as finance, education, health food and cooking, HR, and many others. The tools of this package's solutions are a powerful assistant in drawing all diversity of Financial and Marketing infographics, Business process workflow diagrams, Organizational charts, Education infographics, Quality diagrams, Health food diagrams, HR flowcharts, as well as different graphics and charts, which depict the values of key business indicators, their dependencies, give the full understanding of a situation within a company and on the market.
 Target and Circular Diagrams
This solution extends ConceptDraw DIAGRAM software with samples, templates and library of design elements for drawing the Target and Circular Diagrams.
 Business Diagrams
The Business Diagrams Solution extends ConceptDraw DIAGRAM v12 with an extensive collection of professionally designed illustrative samples and a wide variety of vector stencils libraries, which are the real help for all business-related people, business analysts, business managers, business advisers, marketing experts, PR managers, knowledge workers, scientists, and other stakeholders allowing them to design the bright, neat, expressive and attractive Bubble Diagrams, Circle-Spoke Diagrams, Circular Arrows Diagrams, and Venn Diagrams with different quantity of sets in just minutes; and then successfully use them in documents, reports, statistical summaries, and presentations of any style.
- Pie Charts | Percentages of the U.S. population by race | USA Maps ...
- Percentages of the U.S. population by race | Pie Charts | Pictures of ...
- Percentage Pie Chart . Pie Chart Examples | Percentages of the U.S. ...
- How to Draw a Pie Chart Using ConceptDraw PRO | Pie Chart ...
- Chart Templates | Pie Charts | Chart Examples | Percentage Chart Png
- How to Draw a Pie Chart Using ConceptDraw PRO | Pie Chart ...
- U.S. primary energy consumption by source and sector | U.S. energy ...
- Exploded pie chart (percentage) - Template
- Economic sector weightings | Chart Examples | Pie Chart Of Tertiary ...
- Population growth by continent | San Francisco population history ...