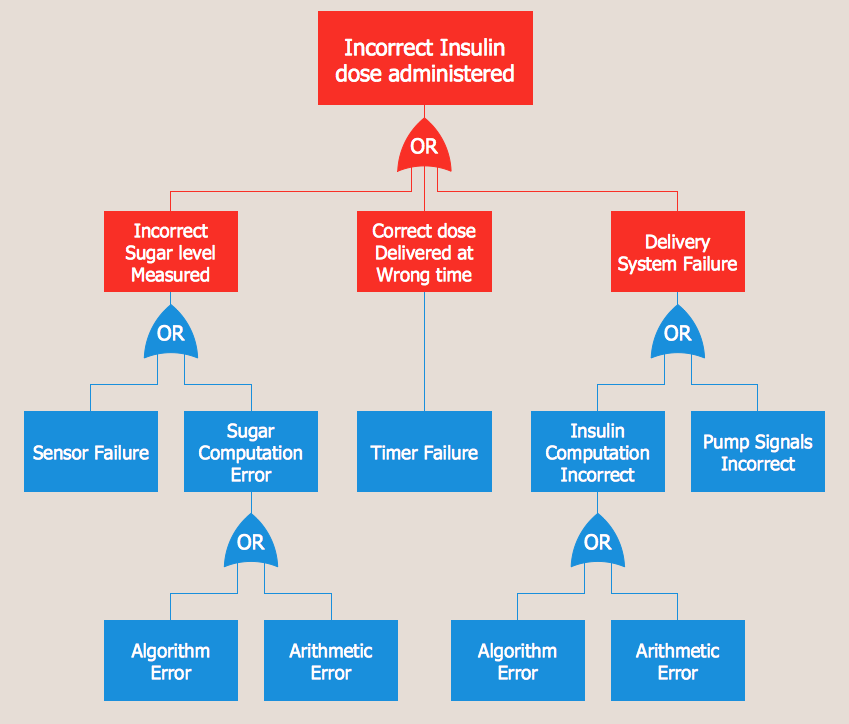
Fault Tree Diagram
ConceptDraw DIAGRAM diagramming and vector drawing software offers the Fault Tree Analysis Diagrams Solution from the Industrial Engineering Area of ConceptDraw Solution Park for quick and easy creating the Fault Tree Diagram of any degree of detailing.HelpDesk
How to Create a Fault Tree Analysis Diagram (FTD)
Fault Tree Diagram is a logic diagram that shows the state of an entire system in a relationship of the conditions of its elements. Fault Tree Diagram is used to analyze the probability of functional system failures and safety accidents. ConceptDraw DIAGRAM allows you to create professional Fault Tree Diagrams using the basic FTD symbols. An FTD visualizes a model of the processes within a system that can lead to the unlikely event. A fault tree diagrams are created using standard logic symbols. The basic elements in a fault tree diagram are gates and events.MS Visio Look a Like Diagrams
No need for any special drawing skills to create professional looking diagrams outside of your knowledge base. ConceptDraw DIAGRAM takes care of the technical details, allowing you to focus on your job, not the drawing. ConceptDraw DIAGRAM delivers full-functioned alternative to MS Visio. ConceptDraw DIAGRAM supports import of Visio files. ConceptDraw DIAGRAM supports flowcharting, swimlane, orgchart, project chart, mind map, decision tree, cause and effect, charts and graphs, and many other diagram types.Fault Tree Analysis Example
Designing the Fault Tree Analysis (FTA) Diagrams first of all it is important to have a powerful software. ConceptDraw DIAGRAM diagramming and vector drawing software extended with Fault Tree Analysis Diagrams Solution from the Industrial Engineering Area is exactly what you need. It is also convenient to have professional looking Fault Tree Analysis example before the eyes, and it is excellent that this solution includes large collection of such examples.HelpDesk
How To Create Root Cause Analysis Diagram Using Solutions
Root Cause Analysis (RCA) is used to determine the main causes of the problem. If the certain factor is the root cause, this mean that its vanishing will help to prevent the further recurrence of the problem. Root Cause Analysis diagram is used to analyze the root causes of factors that influence the problem. It helps to identify the root causes for a factor and then propose possible corrective actions. A diagram is constructed separately for each high priority factor. The ability to create a RCA tree diagram from a mind map is supported by the ConceptDraw Seven Management and Planning Tools solution.HelpDesk
How To Create Cause and Effect (Fishbone) Diagram in MS Visio
Cause-and-Effect Ishikawa Diagram is a graphical method of analysis and cause-effect relationships, a tool in the form of fish bone. It is used to systematically determine the cause of the problem and represent it graphically. The technique is primarily used in the framework of quality management for the analysis of quality problems and their causes. Nowadays, it has found worldwide distribution and is used in multiple problem areas. It is one of the tools of lean manufacturing, which is used in group work to find the problems and their causes. ConceptDraw DIAGRAM allows you to easily create Fishbone (Ishikawa) diagram and then make a MS Visio VSDX, or VSD files from your diagrams in a couple clicks, using the export capabilities of ConcewptDraw DIAGRAM.HelpDesk
How to Convert MS Visio Custom Stencil to ConceptDraw DIAGRAM
Microsoft Visio allows users to create a new custom stencil to store objects that one want to reuse later or share it with other people. ConceptDraw DIAGRAM supports the possibility to open Visio custom stencils and shapes. With the introduction of Visio 2013 Microsoft has changed the native file format used in earlier versions of Microsoft Visio. Thus, when you are looking for professional tool to open and save in the newer Visio 2013 file format on Mac. ConceptDraw DIAGRAM is exactly solution for you.
Family Tree
Family Tree solution with included vector design shapes for drawing family trees, pedigree chart symbols, photo blocks of different detailing and professionally designed samples, extends the functionality of ConceptDraw DIAGRAM software making it the best family tree maker and easy-to-use ancestry trees designer program for researchers, scientists, historians, genetics, medics, archeologists, and other stakeholders. Use it to design informative and colorful genealogy trees, simple family tree or extensive ancestry tree of any depth, genealogy schematics and illustrations with family trees.
Cisco Network Topology. Cisco icons, shapes, stencils and symbols
Cisco Network Topology represents the arrangement of worldwide recognized and standardized Cisco network symbols, icons, shapes, and stencils which help visualize the schemes of computer networks. Any equipment used in Cisco networks is also named a node and network topology diagram represents the scheme of connection the used nodes. Cisco Network Diagram illustrates how the signals enter on the networked devices and how the data spread within a network from one device to another. These diagrams are useful for engineers while constructing computer networks and working with them. Cisco Network Diagrams solution included to Computer and Networks area of ConceptDraw Solution Park contains quick-start templates, professionally designed samples and examples, and numerous libraries with a lot of predesigned vector design elements, icons, and shapes of Cisco equipment, components, devices, links which provide for ConceptDraw DIAGRAM users a perfect possibility of simple and quick drawing Cisco Network Diagrams and Schematics, Network Designs and Maps of any complexity.Matrix Organization Structure
Matrix organizational structure is one of the main forms of structures which is actively used by organizations to carry forth the functions of a company visually and effectively. Now we have ConceptDraw DIAGRAM diagramming and vector drawing software extended with 25 Typical Orgcharts solution from the Management area of ConceptDraw Solution Park which will help easy represent matrix organizational structure of any degree of complexity.- Fault Tree Diagram | MS Visio Look a Like Diagrams | Is ...
- Fault Tree Diagram | ConceptDraw DIAGRAM Compatibility with MS ...
- Ivr Flow Chart Visio
- Fault Tree Analysis Visio Sample
- Fault Tree Diagram | Marketing Charts | IDEF0 Visio | Decision Tree ...
- Influence Diagram Software | ConceptDraw PRO Compatibility with ...
- Decision tree diagram | Marketing Diagrams | MS Visio Look a Like ...
- Visio Tree Diagram
- Bar Chart Template for Word | Stakeholder Onion Diagram Template ...
- Free Visio For Mac Fault Tree