HelpDesk
How to Create Organizational Chart Quickly
Use ConceptDraw MINDMAP for generating structured data on organization structure and then ConceptDraw DIAGRAM for presenting the results as chart.HelpDesk
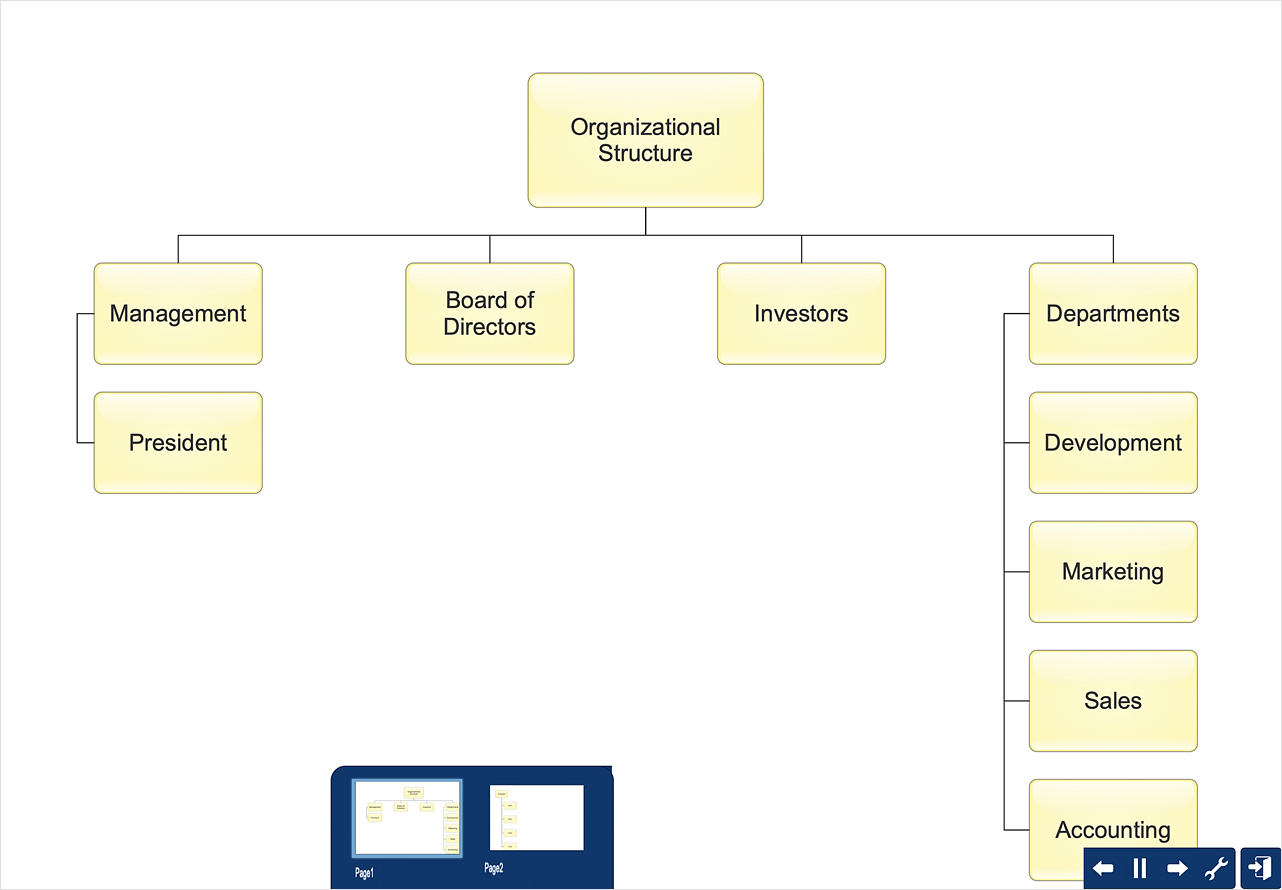
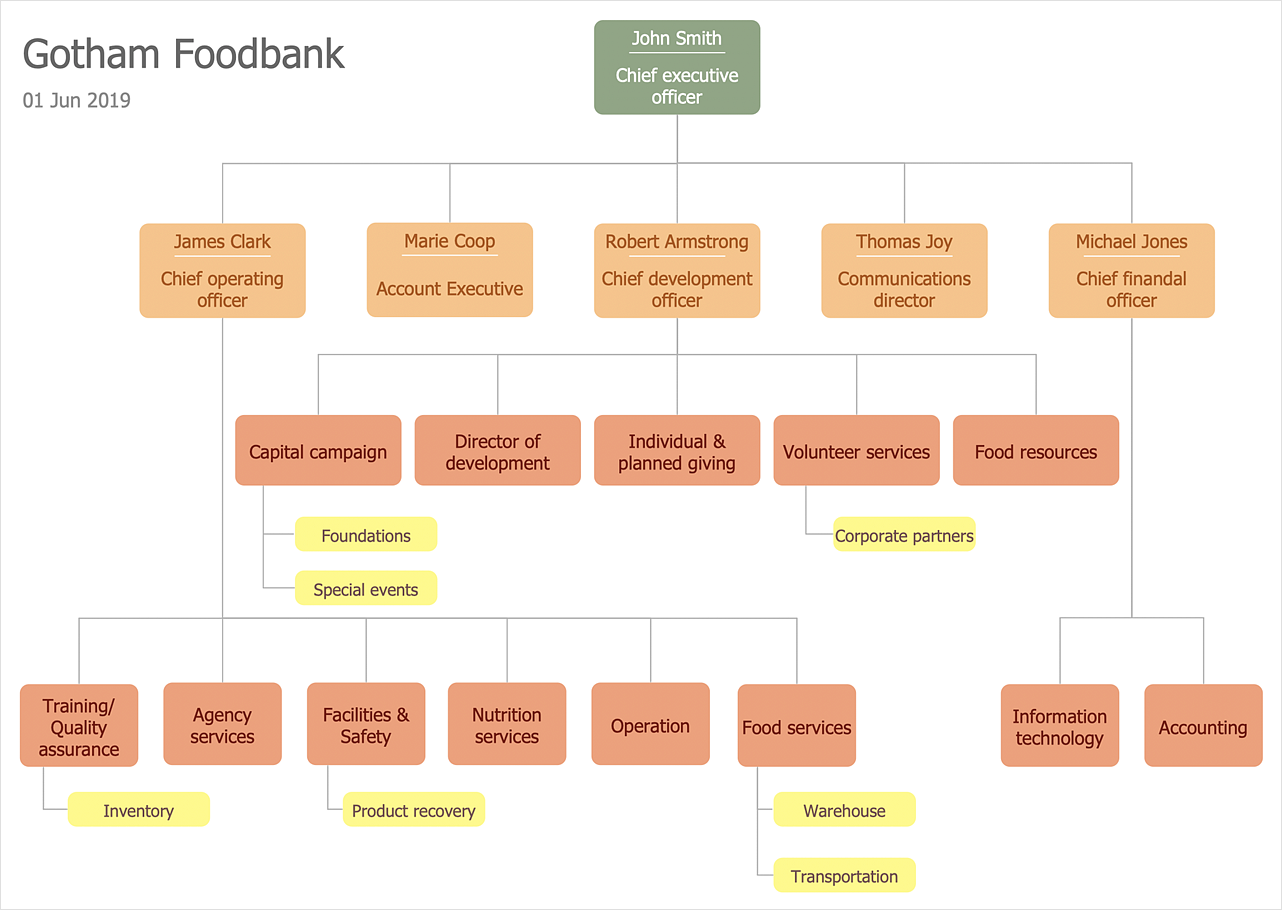
How to Draw an Organizational Chart
Polish your diagram appearance using the tools provided in the Format panel. The organizational chart software is a valuable tool for modern business. It is important for any business to build a clear organizational structure that determines the responsibilities and relationships between different positions in the organization. The clear structured organization - means the clear structured business workflow, which is the core of success in the business. ConceptDraw DIAGRAM is an org chart software that allows you to draw an organizational structure of your company quickly and easily.
 25 Typical Orgcharts
The 25 Typical Orgcharts solution contains powerful organizational structure and organizational management drawing tools, a variety of professionally designed organization chart and matrix organization structure samples, 25 templates based on various orga
 Organizational Charts
Organizational Charts solution extends ConceptDraw DIAGRAM software with samples, templates and library of vector stencils for drawing the org charts.
 ConceptDraw Solution Park
ConceptDraw Solution Park collects graphic extensions, examples and learning materials
Applications
ConceptDraw DIAGRAM is a multipurpose software from ConceptDraw suite intended for diagramming, business and technical drawing, and visual documenting. You can reach a lot of practical benefits from the use of ConceptDraw DIAGRAM. The list of ConceptDraw DIAGRAM applications and versatile possibilities is extremely great. Among them network and system diagramming, business diagramming, Cisco network design, network visualization, software and database design, software development, business flowcharting, data flow design, databases modeling and visualization, business processes modeling, business drawing, technical drawing, GUI prototyping, Organizational charts construction, business processes fixing, web site planning and design, Internet solutions design, information architecture design, UML modeling, ER diagrams design, home and landscape design, and a lot of other applications. ConceptDraw DIAGRAM offers the users a beneficial collaboration, compatibility with MS Visio and many other popular programs, including other products from ConceptDraw suite.HelpDesk
How to Create a Time Series Dashboard
Time Series Dashboard means integration of some type of diagrams: Line Charts, Bar Charts, Column Charts, and Dot Plots on a single space. The ConceptDraw Time Series Dashboard solution can be used to create the interactive Time Series dashboard. The libraries of Time Series Charts solution contain the Live Objects, that can change their appearance depending on the external data. Each chart from the Time Series dashboard displays particular source data. You can include Time Series Charts in your business or technical dashboards to show and compare the items changing over time.
 Project Management Area
Project Management area provides Toolbox solutions to support solving issues related to planning, tracking, milestones, events, resource usage, and other typical project management functions.
HelpDesk
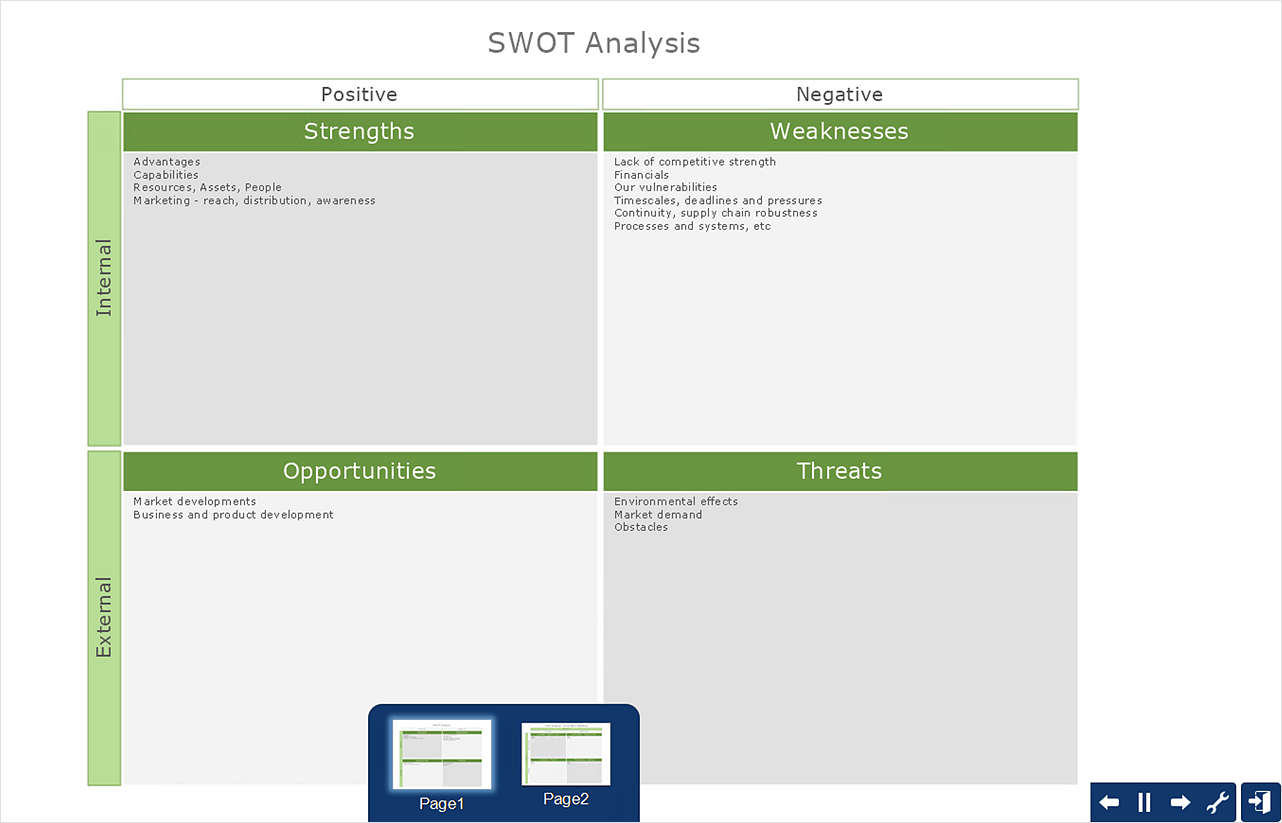
How to Create a SWOT Matrix Quickly
ConceptDraw DIAGRAM allow create SWOT Matrix in just one click for presenting analysis results preformed in mimd map structure using ConceptDraw MINDMAP.- Organizational Structure Total Quality Management | Identifying ...
- Organizational Structure Total Quality Management
- Organizational Structure Total Quality Management | Identifying ...
- How to Draw an Organization Chart | Organizational Structure Total ...
- Organizational Structure Total Quality Management | Fishbone ...
- Organizational Structure Total Quality Management | Organisational ...
- Organizational Structure | Organizational Structure Total Quality ...
- Organizational Structure | How to Draw an Organization Chart ...
- Organizational Chart Template | How to Draw an Organization Chart ...
- Organizational Structure | How to Draw an Organization Chart ...
- How to Draw an Organization Chart | Organizational Structure ...
- Organizational Structure | Business Processes | ConceptDraw PRO ...
- How to Draw an Organization Chart | Organizational Structure ...
- Cause and Effect Analysis (Fishbone Diagrams) | TQM Diagram ...
- How to Draw an Organization Chart | Organizational Structure ...
- How to Build a Flowchart | Flowchart Software | TQM Diagram ...
- Examples of Flowcharts, Org Charts and More | IDEF1X Standard ...
- Affinity diagram - Implementing continuous process improvement ...
- UML Composite Structure Diagram | Data structure diagram with ...
- How to Draw an Organization Chart | Organizational Structure ...


