Quality Management Tools
-Diagram-in-SolutionBrowser.png)
The Fifty Two Elements of TQM
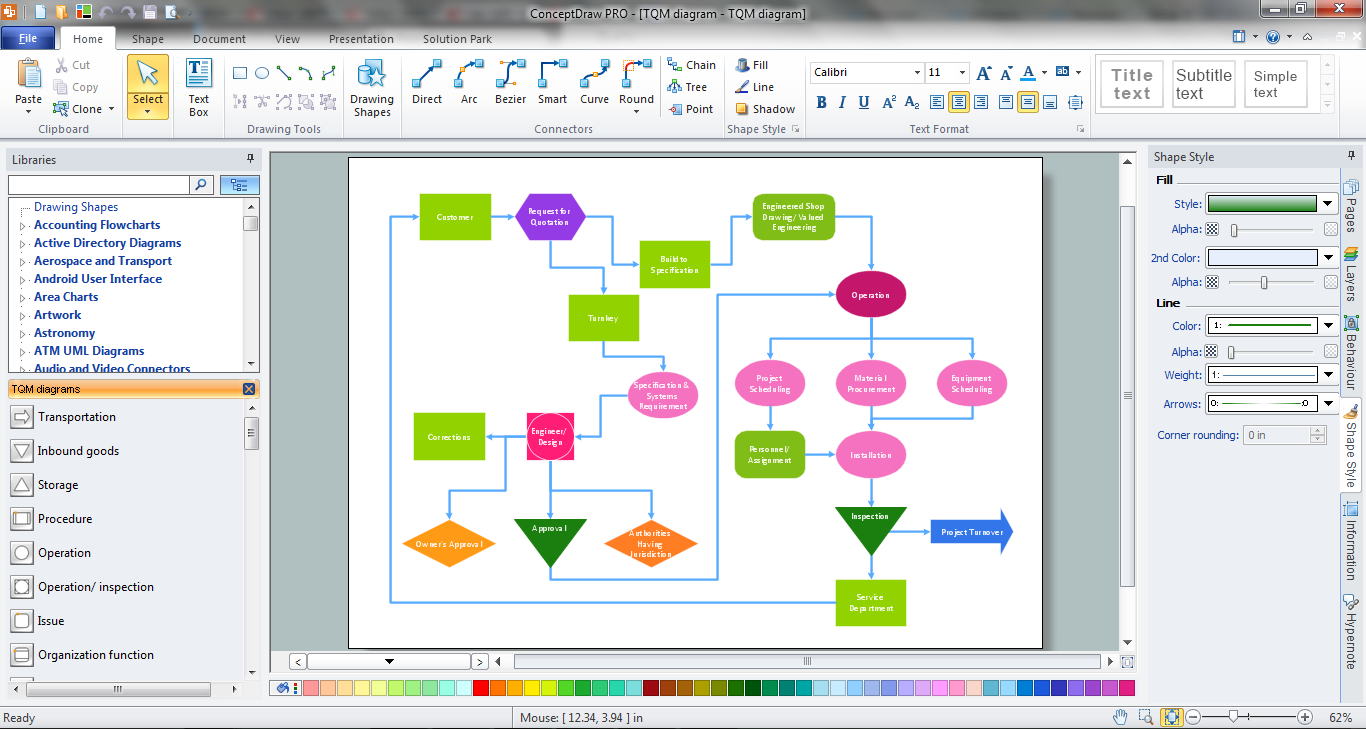
TQM Diagram Tool

TQM Tools
Create TQM Flowcharts for Mac
Seven Basic Tools of Quality — Quality Control

Organizational Structure Total Quality Management

TQM Software
"Classic TQM Tools ...
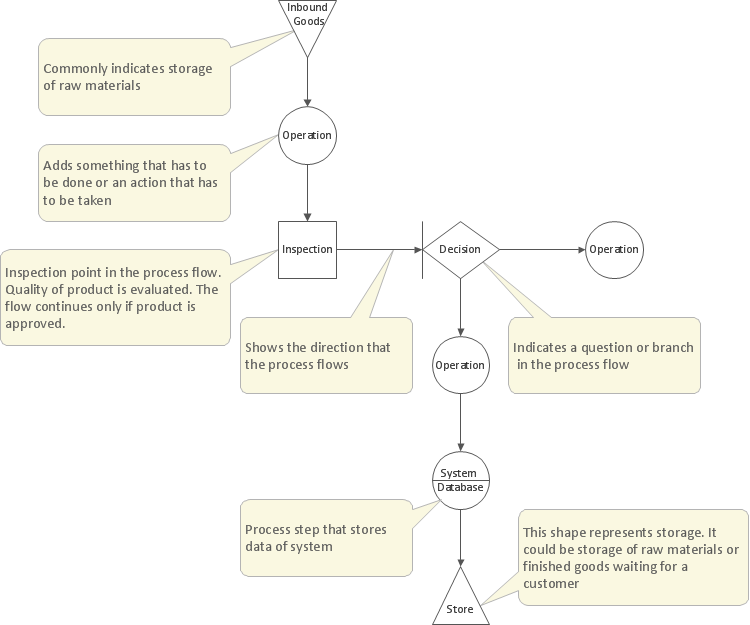
Flow Charts Pictures, symbols or text coupled with lines, arrows on lines show direction of flow. Flowcharting enables
modeling of processes; problems/ opportunities and decision points etc. It develops a common understanding of a process by those in
volved." [whaqualitycenter.org/ Portals/ 0/ Tools%20 to%20 Use/ Classic%20 Quality%20 Tools/ Classic%20 TQM%20 Tools%20 R%20 2-12.pdf]
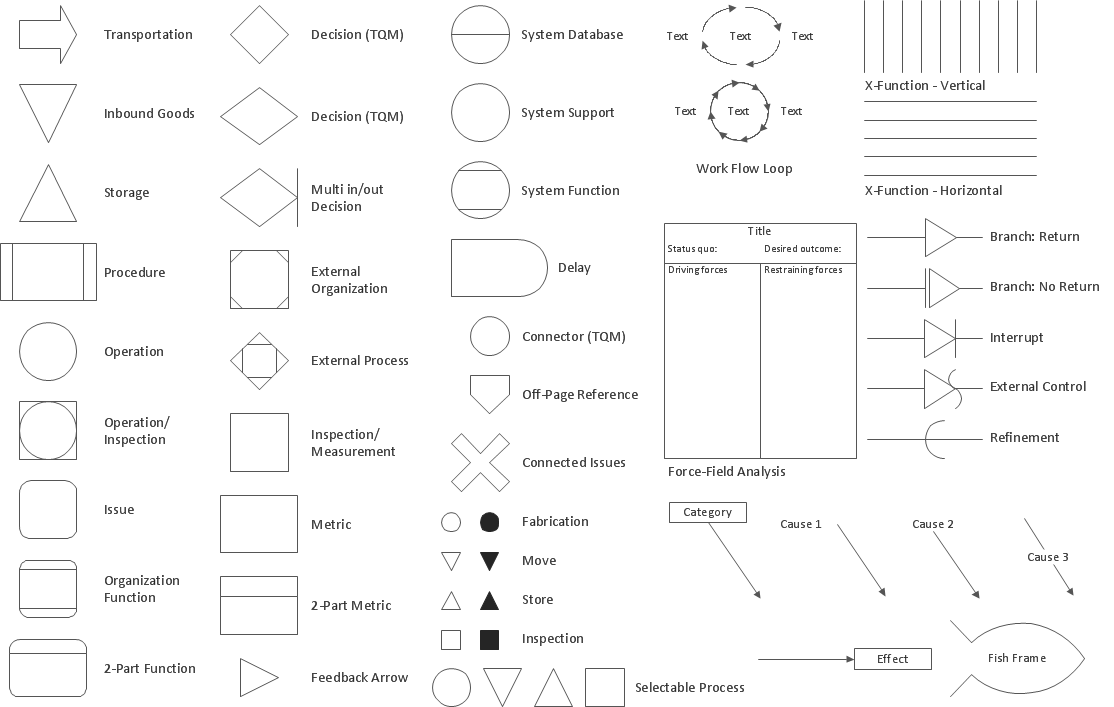
The vector stencils library TQM diagrams contains 58 symbols for drawing total quality management (TQM) flow charts using the ConceptDraw PRO diagramming and vector drawing software.
The example "Design elements - TQM diagram" is included in the Total Quality Management (TQM) Diagrams solution from the Quality area of ConceptDraw Solution Park.
Flow Charts Pictures, symbols or text coupled with lines, arrows on lines show direction of flow. Flowcharting enables
modeling of processes; problems/ opportunities and decision points etc. It develops a common understanding of a process by those in
volved." [whaqualitycenter.org/ Portals/ 0/ Tools%20 to%20 Use/ Classic%20 Quality%20 Tools/ Classic%20 TQM%20 Tools%20 R%20 2-12.pdf]
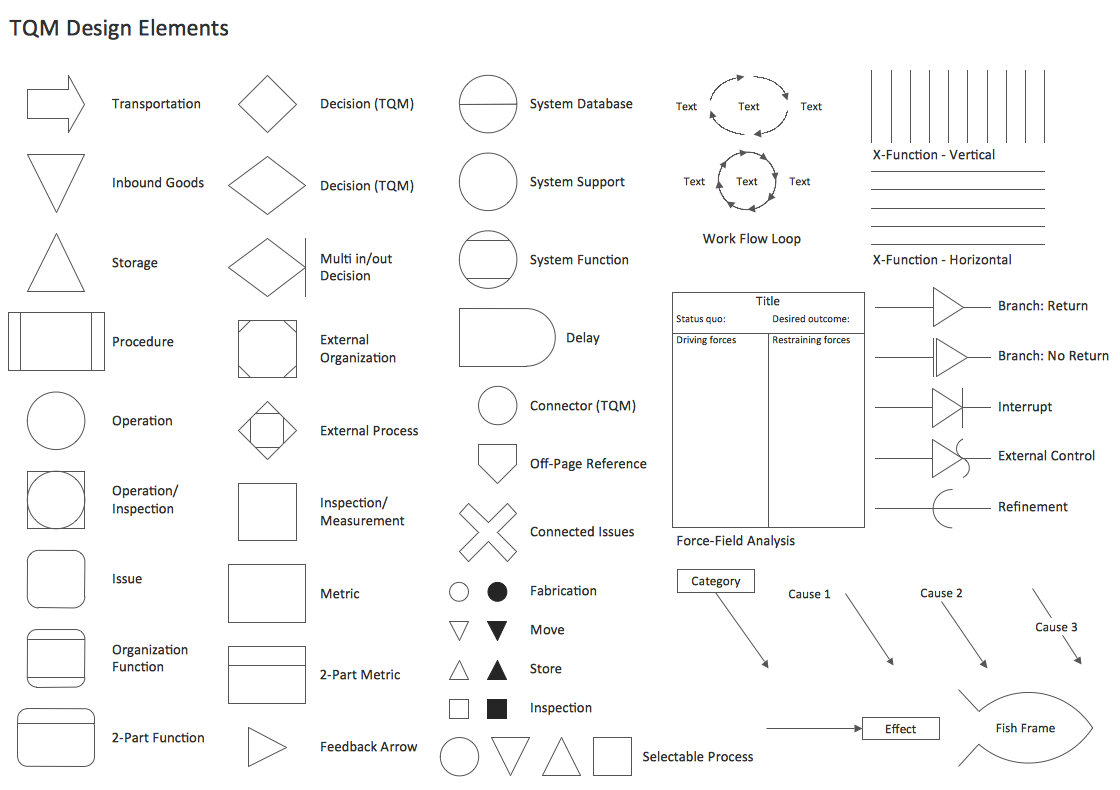
The vector stencils library TQM diagrams contains 58 symbols for drawing total quality management (TQM) flow charts using the ConceptDraw PRO diagramming and vector drawing software.
The example "Design elements - TQM diagram" is included in the Total Quality Management (TQM) Diagrams solution from the Quality area of ConceptDraw Solution Park.
TQM flow chart symbols

Quality Control Chart Software — ISO Flowcharting

- Total Quality Management Diagram Pdf
- TQM Tools | Total Quality Management | Quality Management Tools ...
- Total Quality Management Structure Diagram Pdf
- Cause And Efect Diagram Of Quality Control Tools Pdf
- Process Flowchart | TQM Software — Build Professional TQM ...
- Total Quality Management Value | Cause and Effect Diagrams ...
- Management Tools — Total Quality Management | Booch OOD ...
- Mechanical Engineering | Total Quality Management TQM Diagrams ...
- Process Charts Of Tqm Pdf
- Use Case Diagrams technology with ConceptDraw PRO | Total ...