This site uses cookies. By continuing to browse the ConceptDraw site you are agreeing to our Use of Site Cookies.

ConceptDraw Arrows10 Technology

How should diagramming software work? The answer is - Fast and easy.

"Tree"- mode drawing works like that. Just select objects in your drawing and press Tree or Chain button to connect all of them just in one click.

Your diagram looks professional and it took only a moment to draw.

Examples of Flowcharts, Org Charts and More

ConceptDraw examples covers a broad spectrum of business graphics categories. We separated all the graphic documents on application areas and had produced multiple solutions for each of them. ConceptDraw provides a wide variety of examples such as flowcharts, organizational charts, business charts, UML diagrams, database and ERD, directional map, network diagrams and lots more. Each solution accommodates 10+ examples that shows specific application cases of a diagram. ConceptDraw STORE is an application for downloading solutions with examples, templates and stencil libraries. Please choose any examples you are interested in, alternatively download them for free; you will need to install ConceptDraw to view them. As you will see, ConceptDraw is very powerful, you can use more than 10000 symbols, examples, and many pre-drawn templates, to create your own spectacular flowcharts, business diagrams, network diagrams and lots more, effortlessly, and in no time at all.
What is ConceptDraw OFFICE

network topology diagram software, network icons, network diagram template, networking icons available, how to draw a network diagram Computer Network Diagrams

network topology diagram software, network icons, network diagram template, networking icons available, how to draw a network diagram
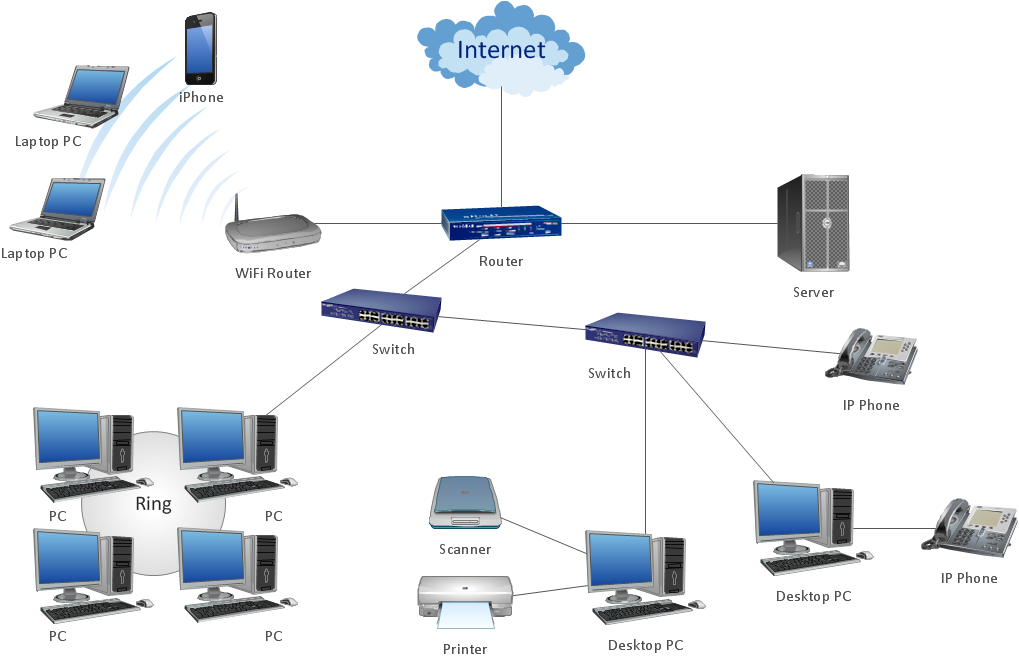
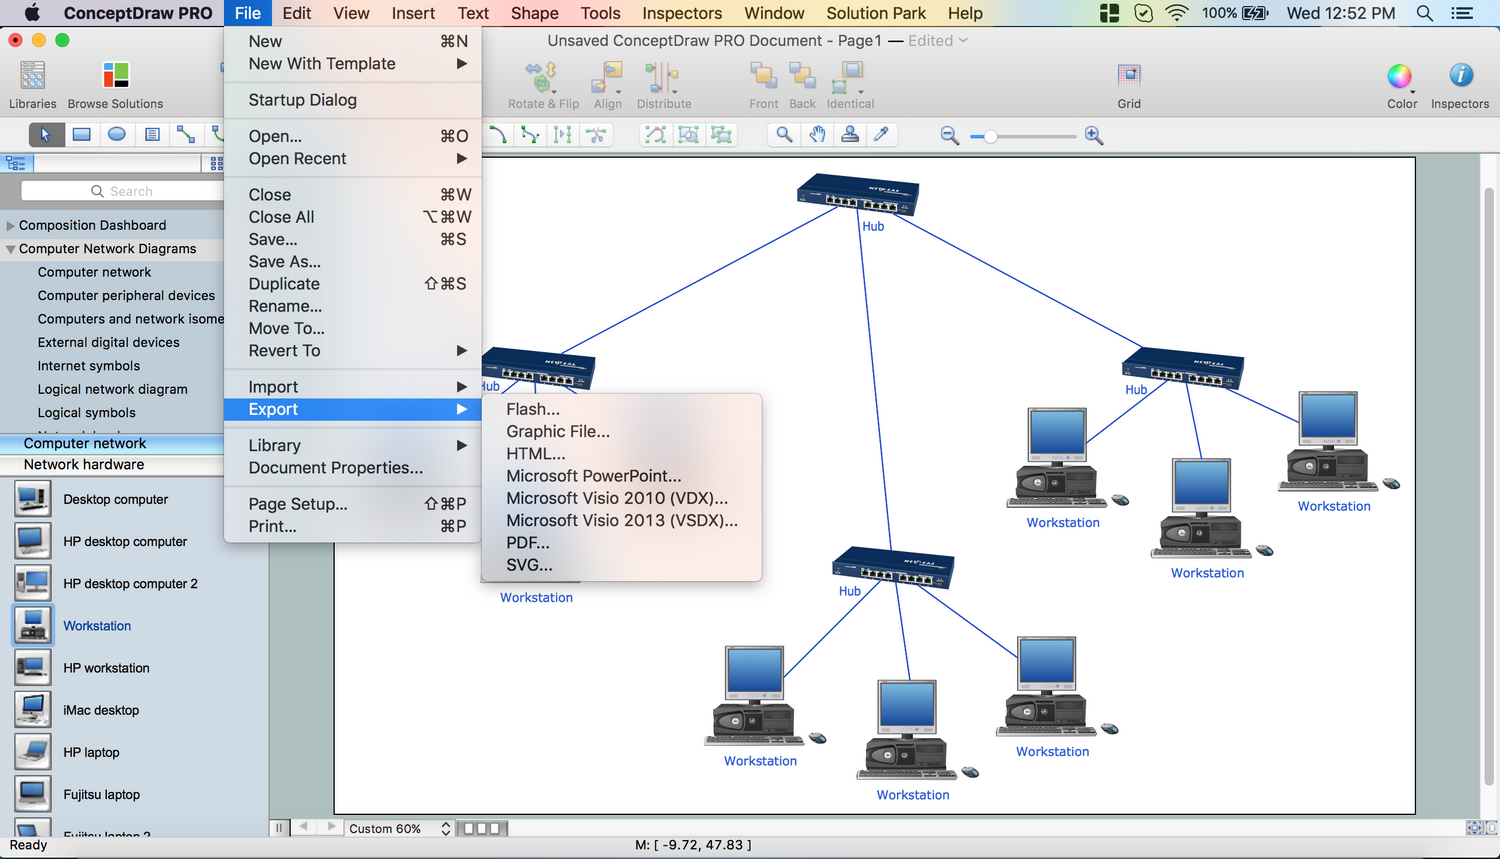
Computer Network Diagrams solution extends ConceptDraw DIAGRAM software with samples, templates and libraries of vector icons and objects of computer network devices and network components to help you create professional-looking Computer Network Diagrams, to plan simple home networks and complex computer network configurations for large buildings, to represent their schemes in a comprehensible graphical view, to document computer networks configurations, to depict the interactions between network's components, the used protocols and topologies, to represent physical and logical network structures, to compare visually different topologies and to depict their combinations, to represent in details the network structure with help of schemes, to study and analyze the network configurations, to communicate effectively to engineers, stakeholders and end-users, to track network working and troubleshoot, if necessary.

Flow Chart Symbols

Flowcharts are used in designing and documenting simple processes or programs. Like other types of diagrams, they help visualize what is going on and thereby help understand a process, and perhaps also find flaws, bottlenecks, and other less-obvious features within it. There are many different types of flowcharts, and each type has its own repertoire of boxes and notational conventions.
Flowchart diagrams consists of symbols of process, decision, data and document, data base, termination or initiation processes, processing loops and conditions. To create an drawn flowchart use professional flowchart maker of ConceptDraw DIAGRAM.

ConceptDraw Arrows10 Technology

How should diagramming software work? Is it possible to develop a diagram as quickly as the ideas come to you? The innovative ConceptDraw Smart Connectors Technology - This is more than enough versatility to draw any type of diagram with any degree of complexity.

Connection points are necessary for diagramming network, flowchart and organizational charts. In ConceptDraw you connect shapes by attaching, or snapping and gluing, connectors to shape connection points.

Network Topology Mapper

Network Topology in communication networks, a topology is a usually schematic description of the arrangement of a network, including its nodes and connecting lines. There are two ways of defining network geometry: the physical topology and the logical topology.

Network Topology Mapper offers extensive drawing tools professional-looking network diagrams quickly and easily allowing you to clearly represent and communicate network architecture, topology, and design to engineers, stakeholders and end-users.

Cisco networking, Cisco network icons, Cisco icon Cisco Network Diagrams

Cisco networking, Cisco network icons, Cisco icon
Cisco Network Diagrams solution extends ConceptDraw DIAGRAM with the best characteristics of network diagramming software. Included samples, templates and libraries of built-in standardized vector Cisco network icons and Cisco symbols of computers, network devices, network appliances and other Cisco network equipment will help network engineers, network designers, network and system administrators, as well as other IT professionals and corporate IT departments to diagram efficiently the network infrastructure, to visualize computer networks topologies, to design Cisco computer networks, and to create professional-looking Cisco Computer network diagrams, Cisco network designs and schematics, Network maps, and Network topology diagrams in minutes.

ERD Symbols and Meanings

Crow's foot notation is used in Barker's Notation, Structured Systems Analysis and Design Method (SSADM) and information engineering. Crow's foot diagrams represent entities as boxes, and relationships as lines between the boxes. Different shapes at the ends of these lines represent the cardinality of the relationship.
The Chen's ERD notation is still used and is considered to present a more detailed way of representing entities and relationships.
To create an ERD, software engineers mainly turn to dedicated drawing software, which contain the full notation resources for their specific database design - ERD symbols and meanings. CS Odessa has released an all-inclusive Entity-Relationship Diagram (ERD) solution for their powerful drawing program, ConceptDraw DIAGRAM.
How to Build an Entity Relationship Diagram (ERD)