This site uses cookies. By continuing to browse the ConceptDraw site you are agreeing to our Use of Site Cookies.

PERT Chart Software

PERT Chart Software - Activity Network and Project Evaluation and Review Technique, or PERT, charts are a way of documenting and analyzing the tasks in a project.
ConceptDraw DIAGRAM is a powerful diagramming and vector drawing software for designing professional looking PERT Charts quick and easy.

Program Evaluation and Review Technique (PERT) with ConceptDraw DIAGRAM

PERT Diagram is a more realistic approach of a project's time estimate analysis. After PERT chart was constructed user can discover the shortest possible duration for entire project timescale. The project timeline is the longest chain that might be taken with connected tasks on the PERT Diagram. Completion of serial tasks need to be accomplished in a presented order. At a project timeline can be independent tasks that not linked with main sequence they are called parallel tasks. PERT diagram is more suitable for Critical Path Analysis than Gantt chart for the reason that it undoubtedly better determine task dependencies. Project managers customarily utilize both methodologies.

seven management and planning tools Seven Management and Planning Tools

seven management and planning tools
Seven Management and Planning Tools solution extends ConceptDraw DIAGRAM and ConceptDraw MINDMAP with features, templates, samples and libraries of vector stencils for drawing management mind maps and diagrams.

How To Create a Flow Chart in ConceptDraw

ConceptDraw DIAGRAM is a flowchart creating software. This software includes over 20 vector stencils in libraries. These objects allow you to create well-designed flowcharts.
Put an initial object from library to a page and use RapidDraw technology clicking on direction arrows to add new objects to the flowchart. This way you can make flowchart quickly.

PERT Chart

The program (or project) evaluation and review technique, commonly abbreviated PERT, is a statistical tool, used in project management, which was designed to analyze and represent the tasks involved in completing a given project. ConceptDraw DIAGRAM diagramming and vector drawing software extended with Seven Management and Planning Tools Solution from the Management Area offers the extensive drawing tools for effective drawing the PERT Chart of any complexity.

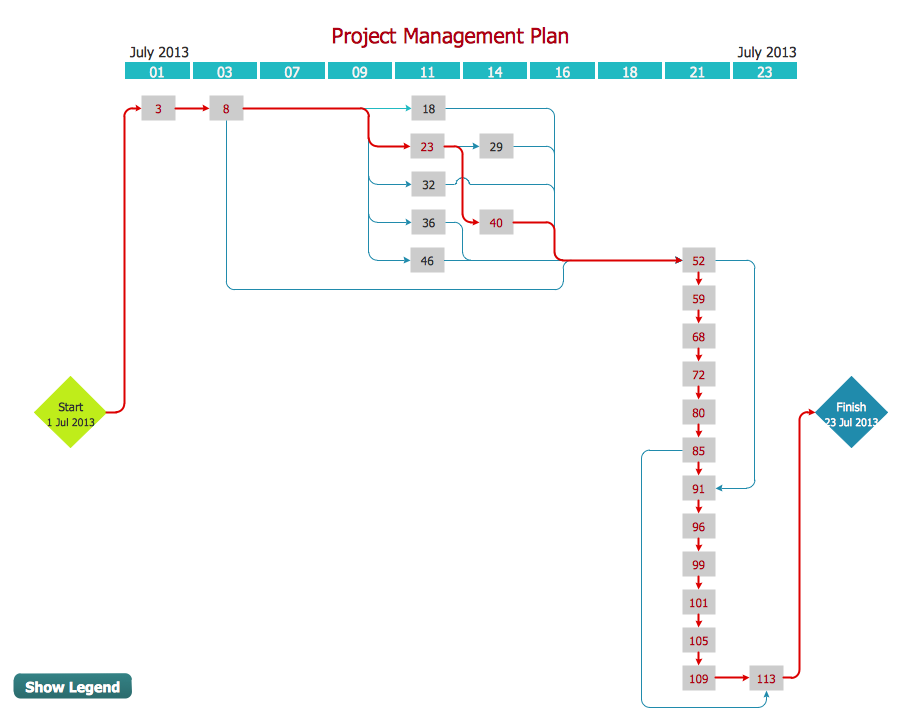
CORRECTIVE ACTIONS PLANNING. PERT Chart

The PERT Chart is constructed as part of the process in creating a schedule of corrective actions. The PERT Chart shows the logical connections and consequence of tasks to be performed. It displays the time period for problem solving and the implementation of all activities through the critical path.
ConceptDraw Office suite is a software for corrective actions planning.
7MP Tools
7MP Tools

ConceptDraw PROJECT Project Management Software Tool

ConceptDraw PROJECT is simple project management software. If you are on the fast track in your career and start facing such challenges as coordination many people, coordination tasks and works, manage project with a great deal of time and money involved - it is the right time to get Project management tool involved in your work.

Activity on Node Network Diagramming Tool

Activity on Node Network Diagramming Tool - Activity Network and Project Evaluation and Review Technique, or PERT, charts are a way of documenting and analyzing the tasks in a project.
This sample shows the Activity on node network diagramming method. It was created in ConceptDraw DIAGRAM diagramming and vector drawing software using the Seven Management and Planning Tools solution from the Management area of ConceptDraw Solution Park.

Activity Network (PERT) Chart

Activity Network and Project Evaluation and Review Technique, or PERT, charts are a way of documenting and analyzing the tasks in a project.
This diagram is constructed as part of the process in creating a schedule of corrective actions. The Activity Network Chart (PERT) shows the logical connections and consequence of tasks to be performed. It displays the time period for problem solving and the implementation of all activities through the critical path.

Basic Diagramming

ConceptDraw DIAGRAM with the specific tools you need to easily draw flowcharts, block diagrams, bar charts, histograms, pie charts, divided bar diagrams, line graphs, area charts, scatter plots, circular arrows diagrams, Venn diagrams, bubble diagrams, concept maps, electrical circuit diagrams, schematics,and others.
Use Basic Diagramming solution to draw you own diagrams, charts and graphs for graphic communication, explanation of business and personal ideas and concepts, simple visual presentation of numerical data, complex structures, logical relations, step-by-step flows of actions or operations.