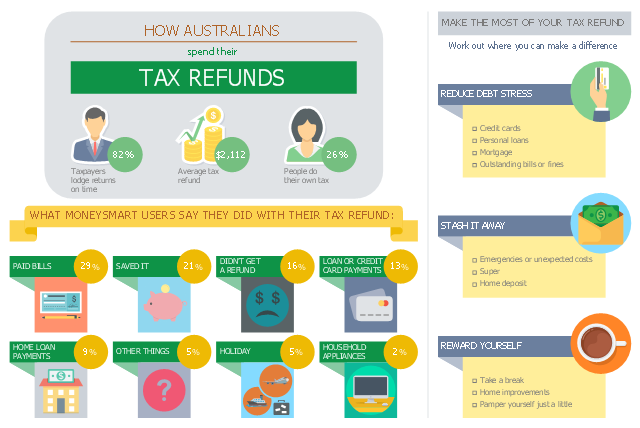
This business infographic sample shows the average tax refund and how people say they spent last year's tax refund. It was designed on the base of the infographic "How Australians spend their tax refunds" from the MoneySmart website of the Australian Securities and Investments Commission (ASIC).
[moneysmart.gov.au/ managing-your-money/ income-tax/ how-australians-spend-their-tax-refunds]
"A tax refund or tax rebate is a refund on taxes when the tax liability is less than the taxes paid. Taxpayers can often get a tax refund on their income tax if the tax they owe is less than the sum of the total amount of the withholding taxes and estimated taxes that they paid, plus the refundable tax credits that they claim. (Tax refunds are money given back at the end of the financial year.)" [Tax refund. Wikipedia]
The business infographic example "How Australians spend their tax refunds" was designed using ConceptDraw PRO diagramming and vector drawing software extended with the Business and Finance solution from Illustration area of ConceptDraw Solution Park.
Infographic
This sale dashboard example contains KPIs and sales effectiveness metrics visual indicators: speedometer gauge, dial, slider, level meter and bullet indicators.
"Sales effectiveness refers to the ability of a company’s sales professionals to “win” at each stage of the customer’s buying process, and ultimately earn the business on the right terms and in the right timeframe.
Improving sales effectiveness is not just a sales function issue; it’s a company issue, as it requires deep collaboration between sales and marketing to understand what’s working and not working, and continuous improvement of the knowledge, messages, skills, and strategies that sales people apply as they work sales opportunities.
Sales effectiveness has historically been used to describe a category of technologies and consulting services aimed at helping companies improve their sales results.
Many companies are creating sales effectiveness functions and have even given people titles such as VP of Sales Effectiveness." [Sales effectiveness. Wikipedia]
The example "Sales metrics and KPIs" was created using the ConceptDraw PRO diagramming and vector drawing software extended with the Meter Dashboard solution from the area "What is a Dashboard" of ConceptDraw Solution Park.
Sales dashboard

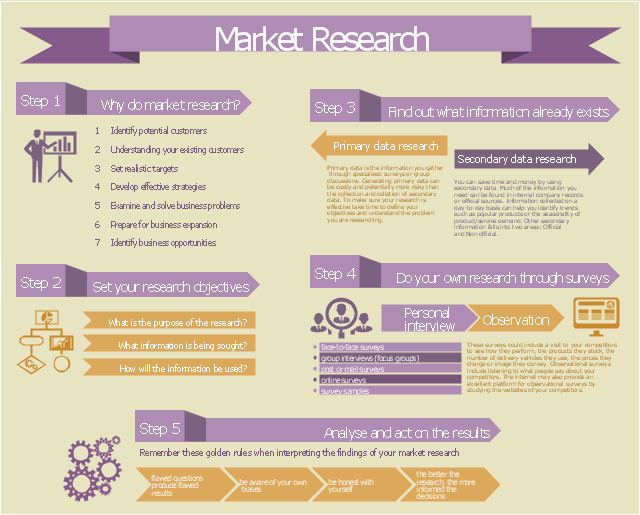
This example of marketing infogram was created on the base of web page "Market research" from the website of West Australian State Government agency Small Business Development Corporation (SBDC).
"Market research is a key part of developing your marketing strategy. It’s about collecting information to give you an insight into your customers’ mind so that you understand what they want, how they gather information and where they come from. You can also do market research to get a better idea of market trends and what is happening in your industry sector.
The information you gather and analyse builds the foundation of good business decisions whether it’s deciding what product or service you’ll offer, where your business should be located, how to distribute your products or how you communicate with consumers." [smallbusiness.wa.gov.au/ market-research]
The example "Marketing Infographics - Market Research" was created using the ConceptDraw PRO diagramming and vector drawing software extended with the Marketing Infographics solition from the area "Business Infographics" in ConceptDraw Solution Park.
Marketing infogram
Social Media Marketing Infographic

Typography Art

Typography Infographic Software

 Timeline Diagrams
Timeline Diagrams solution extends ConceptDraw PRO diagramming software with samples, templates and libraries of specially developed smart vector design elements of timeline bars, time intervals, milestones, events, today marker, legend, and many other elements with custom properties, helpful for professional drawing clear and intuitive Timeline Diagrams. Use it to design simple Timeline Diagrams and designate only the main project stages, or highly detailed Timeline Diagrams depicting all project tasks, subtasks, milestones, deadlines, responsible persons and other description information, ideal for applying in presentations, reports, education materials, and other documentation.
- Bullet Ribbon Png
- Title Ribbon Png
- Orange Triangle Bullet
- List Bullet Png
- Text Bullets Png
- Red Line Bar Png
- Vector Backgrounds Png
- Radial Arrow Png
- ConceptDraw Solution Park | Black Transparent Bar Png
- Dashboard Gauge Png
- Bullet Vector Png
- Infographic Templates For Bullets
- Kpis Png
- Bullet Typography
- Indicator Png
- Png Indicator
- Red Loading Bar Png
- Ribbon Text Box Png
- Management And Interaction Png
- School Text Background Vector Png