How to Make a Timeline

Timeline Diagrams

Project Timeline

Timeline Examples

The vector stencils library "Value stream mapping" contains 43 VSM symbols.
Use it for drawing value stream maps in the ConceptDraw PRO diagramming and vector drawing software extended with the Value Stream Mapping solution from the Quality area of ConceptDraw Solution Park.
www.conceptdraw.com/ solution-park/ business-value-stream-mapping
Use it for drawing value stream maps in the ConceptDraw PRO diagramming and vector drawing software extended with the Value Stream Mapping solution from the Quality area of ConceptDraw Solution Park.
www.conceptdraw.com/ solution-park/ business-value-stream-mapping
Inventory
Inventory

Information Flow
Shipment
Shipment
Material Flow
Material Pull
FIFO Line
Truck shipment/Logistics
Customer/Supplier
Dedicated Process

Shared Process
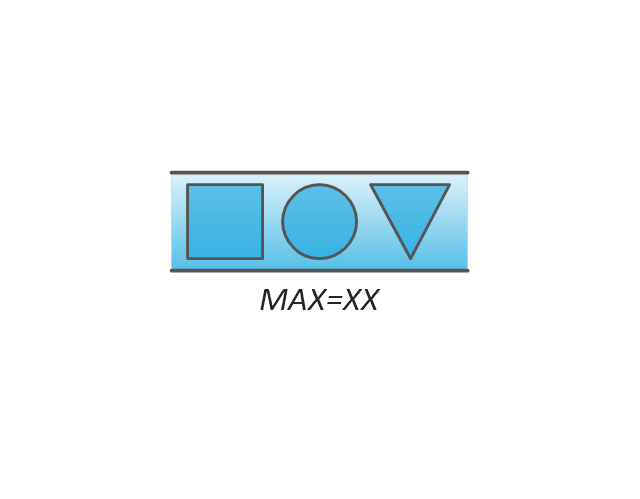
Supermarket Parts
Data Box
Workcell
Kaizen Burst
Operator
Other
Production Control
Manual Info
Electronic Information Flow
Production Kanban
Withdrawal Kanban
Signal Kanban
Kanban Post
Sequenced Pull
Load Levelling

MRP/ERP
Go-See
Pull Arrow
Manual Info
Pull Arrow
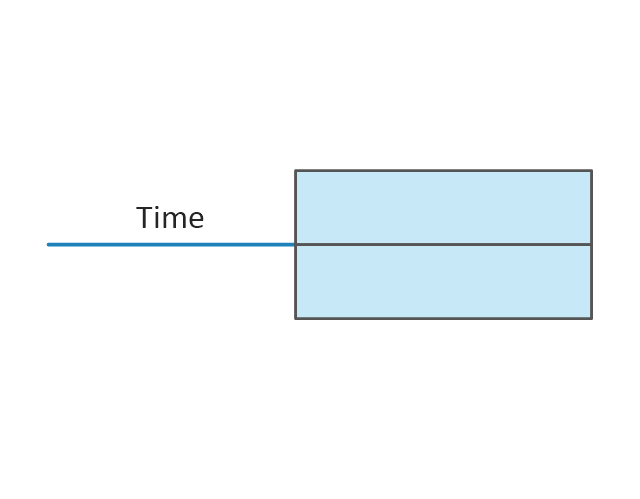
Timeline Total
Ship
Forklift Truck
Plane
Process with Data
Timeline
Timeline
Supermarket, 2

Supermarket, 3

Safety stock, 2
Safety stock, 3
The vector stencils library "Timelines and milestones" contains 24 shapes of time scales with start and finish dates, time interval bars with progress indication and brackets, milestone, event and today markers for drawing the timeline diagrams using the ConceptDraw PRO diagramming and vector drawing software.
"A timeline is a way of displaying a list of events in chronological order, sometimes described as a project artifact. It is typically a graphic design showing a long bar labelled with dates alongside itself and (usually) events labelled on points where they would have happened. ...
Another type of timeline is used for project management. In these cases, timelines are used to help team members to know what milestones need to be achieved and under what time schedule. For example, in the case of establishing a project timeline in the implementation phase of the life cycle of a computer system." [Timeline. Wikipedia]
The example "Design elements - Timelines solution" is included in the Timeline Diagrams solution from the Management area of ConceptDraw Solution Park.
Timeline and milestone symbols

 Timeline Diagrams
Timeline Diagrams solution extends ConceptDraw PRO diagramming software with samples, templates and libraries of specially developed smart vector design elements of timeline bars, time intervals, milestones, events, today marker, legend, and many other elements with custom properties, helpful for professional drawing clear and intuitive Timeline Diagrams. Use it to design simple Timeline Diagrams and designate only the main project stages, or highly detailed Timeline Diagrams depicting all project tasks, subtasks, milestones, deadlines, responsible persons and other description information, ideal for applying in presentations, reports, education materials, and other documentation.
HelpDesk
How to Create a Timeline Diagram in ConceptDraw PRO

Timeline charts presents events and time periods on a chronological scale. They are used in project management to visualize project milestones and upper level phases, and show project progress.
"Within the framework of project management, a milestone is an event that receives special attention. It is often put at the end of a stage to mark the completion of a work package or phase. Milestones can be put before the end of a phase so that corrective actions can be taken, if problems arise, and the deliverable can be completed on time.
In addition to signaling the completion of a key deliverable, a milestone may also signify an important decision or the derivation of a critical piece of information, which outlines or affects the future of a project. In this sense, a milestone not only signifies distance traveled (key stages in a project) but also indicates direction of travel since key decisions made at milestones may alter the route through the project plan." [Milestone (project management). Wikipedia]
This timeline diagram example was created using the ConceptDraw PRO diagramming and vector drawing software extended with the Timeline Diagrams solution from the Management area of ConceptDraw Solution Park.
Timeline

Infographic Generator

Process Flowchart


This area chart sample shows the US federal prisoner population changes from 1914 to 2010.
"The Federal Bureau of Prisons (BOP) is a United States federal law enforcement agency. A subdivision of the U.S. Department of Justice, the Bureau is responsible for the administration of the federal prison system. The system also handles prisoners who committed acts considered felonies under the District of Columbia's law. The Bureau was established in 1930 to provide more progressive and humane care for federal inmates, to professionalize the prison service, and to ensure consistent and centralized administration of the 11 federal prisons in operation at the time.
According to its official web site, the Bureau consists of more than 116 institutions, six regional offices, its headquarters office in Washington, D.C., two staff training centers, and 22 community corrections offices, and is responsible for the custody and care of approximately 210,000 federal offenders. Approximately 82 percent of these inmates are confined in Bureau-operated correctional facilities or detention centers. The remainder are confined through agreements with state and local governments or through contracts with privately operated community corrections centers, detention centers, prisons, and juvenile facilities." [Federal Bureau of Prisons. Wikipedia]
This area graph sample was redesigned from the Wikimedia Commons file: Federal timeline US prisoners.gif. [commons.wikimedia.org/ wiki/ File:Federal_ timeline_ US_ prisoners.gif]
The area chart example "Federal timeline US prisoners" was created using the ConceptDraw PRO diagramming and vector drawing software extended with the Area Charts solution from the Graphs and Charts area of ConceptDraw Solution Park.
Area graph

Hiring Process

Business Process Mapping — How to Map a Work Process

Activity Network Diagram Method

- Plane geometry - Vector stencils library | Timelines and milestones ...
- Timeline Vector Graphic
- Travel and tourism pictograms - Vector stencils library | How to ...
- Forklift Operator Vector Png
- Travel and tourism pictograms - Vector stencils library | Travel and ...
- Png File Of Mile Stone
- Create A Vector Timeline
- Value stream mapping - Vector stencils library | What is Value ...
- Timelines and milestones - Vector stencils library | How to Make a ...
- Logistic Truck Vector Png
- How to Create a Timeline Diagram in ConceptDraw PRO | Timelines ...
- Timeline Performance Management Png
- Information Logistics Timeline
- Sales Objective Png Vector
- Accounting Flowchart Symbols | Bar Chart Software | Timeline ...
- Professional Career Vector Png
- SDL process Game | Aircraft - Vector stencils library | Plane ...
- Value stream mapping - Vector stencils library | Value stream ...
- How to Create a Timeline Diagram in ConceptDraw PRO | Design ...
- Value stream mapping - Vector stencils library | Circuits and Logic ...