This sample was created on the base of the figure illustrating the webpage "SmartAmerica Challenge Timeline" from the website of the National Institute of Standards and Technology (NIST), an agency of the U.S. Department of Commerce. [nist.gov/ el/ sactl.cfm]
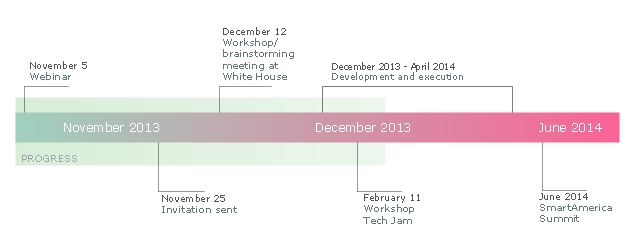
"The SmartAmerica Challenge is a White House Presidential Innovation Fellow project with the goal to bring together research in Cyber-Physical Systems (CPS) and to combine test-beds, projects and activities from different sectors, such as Smart Manufacturing, Healthcare, Smart Energy, Intelligent Transportation and Disaster Response, to show tangible and measurable benefits to the US economy and the daily lives of American citizens.
Cyber-Physical Systems is a name for the combination of the Internet of Things and System Control. So rather than just being able to “sense” where something is, CPS adds the capability to control the “thing” or allow it to interact with physical world around it.
Over 65 Companies, Government Agencies and Academic institutions came together on December 12, 2013 and launched 12 teams/ projects. Since that time 12 new projects have been formed. These teams have been hard at work over the past months building systems, prototypes, pilots and products that demonstrate the capabilities of CPS, but more importantly as the goal of the SmartAmerica Challenge they will show how these technologies will deliver socio-economic benefits to America.
The Challenge will culminate with the SmartAmerica Expo on June 11 at the Washington DC Convention Center." [smartamerica.org/ about/ ]
The timeline diagram example "" was created using the ConceptDraw PRO diagramming and vector drawing software extended with the Timeline Diagrams solution from the Management area of ConceptDraw Solution Park.
Timeline diagram
 Website Wireframe
The innovative Website Wireframe solution enhances the ConceptDraw PRO v10 functionality with newest wireframe tools, libraries with variety of predesigned icons, symbols, buttons, graphics, forms, boxes, and many other vector elements, templates and professionally designed samples, which make it the best wireframing software. Website Wireframe solution gives you significant advantages when designing and maintaining websites, creating skeletal and content-free depictions of website structure, making website prototypes and planning the content arrangement before committing to design, also speeds up the processes of sketching, producing and sharing wireframe examples of website style and interface design.
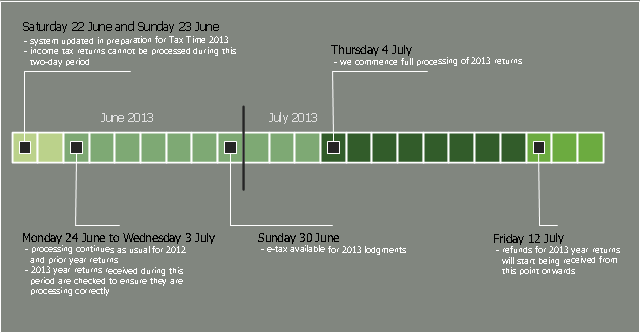
This timeline diagram sample was created on the base of the figure illustrating the webpage "Preparing for Tax Time 2013" from the website of the Australian Taxation Office of the Australian Government. [ato.gov.au/ Tax-professionals/ Prepare-and-lodge/ Tax-Time-2013/ Preparing-for-Tax-Time-2013/ System-availability-and-start-of-return-processing]
"There are many forms of taxation in Australia. Individuals and companies in Australia may be required to pay taxes or charges to all levels of government: local, state, and federal governments. Taxes are collected to pay for public services and transfer payments (redistribution of economic wealth).
Income taxes are the most significant form of taxation in Australia, and collected by the federal government through the Australian Taxation Office. Australian GST revenue is collected by the Federal government, and then paid to the states under a distribution formula determined by the Commonwealth Grants Commission.
Australia maintains a relatively low tax burden in comparison with other wealthy, developed nations, at 25.6% of GDP in 2013." [Taxation in Australia. Wikipedia]
The timeline diagram example "Tax Time 2013 - System availability and processing timeline" was created using the ConceptDraw PRO diagramming and vector drawing software extended with the Timeline Diagrams solution from the Management area of ConceptDraw Solution Park.
Project timeline
 Timeline Diagrams
Timeline Diagrams solution extends ConceptDraw PRO diagramming software with samples, templates and libraries of specially developed smart vector design elements of timeline bars, time intervals, milestones, events, today marker, legend, and many other elements with custom properties, helpful for professional drawing clear and intuitive Timeline Diagrams. Use it to design simple Timeline Diagrams and designate only the main project stages, or highly detailed Timeline Diagrams depicting all project tasks, subtasks, milestones, deadlines, responsible persons and other description information, ideal for applying in presentations, reports, education materials, and other documentation.
 ConceptDraw Solution Park
ConceptDraw Solution Park collects graphic extensions, examples and learning materials
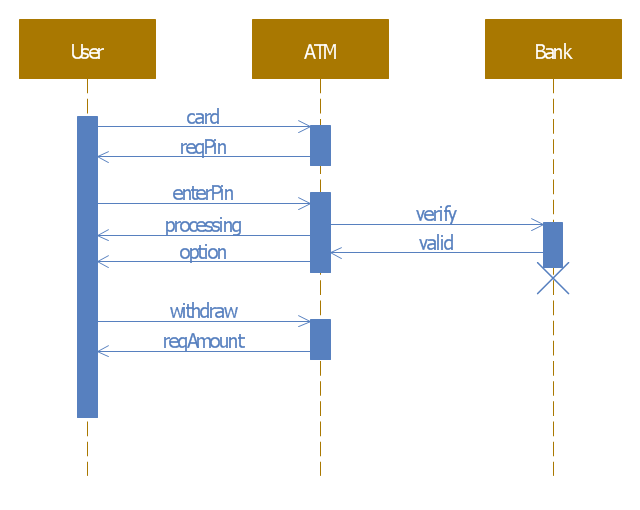
This example of automated teller machine (ATM) UML sequence diagram was created on the base of figure 5 "Sequence diagram" on the webpage "Message Sequence Charts and their Ilk" from the website of the University of California Irvine (UCI) Donald Bren School of Information and Computer Sciences.
"A UML sequence diagram or SD is similar to an MSC but written with a different notation. Presumably the same semantic issues arise, but possibly not since UML semantics are not well-defined. An example is shown in Figure 5.
The timelines are dotted rather than solid, and the name of the component is inside a box at the head of each timeline. The narrow rectangles apparently show when a component is active (unsure precisely what "active" means). An X on a timeline indicates that the component ceases to exist in some sense (unsure precisely how this is meant also). In the example, the Bank timeline has an X simply as an example (presumably the Bank does continue to exist)."
[www.ics.uci.edu/ ~alspaugh/ cls/ shr/ msc.html]
This example of bank ATM sequence diagram was created using the ConceptDraw PRO diagramming and vector drawing software extended with the ATM UML Diagrams solution from the Software Development area of ConceptDraw Solution Park.
Bank ATM UML sequence diagram
Basic Flowchart Symbols and Meaning


 Flowcharts
The Flowcharts solution for ConceptDraw PRO is a comprehensive set of examples and samples in several varied color themes for professionals that need to represent graphically a process. Solution value is added by the basic flow chart template and shapes' libraries of flowchart notation. ConceptDraw PRO flow chart creator lets one depict the processes of any complexity and length, as well as design the Flowchart either vertically or horizontally.
HelpDesk
How to Track Your Project Plan vs. the Actual Project Condition

 Enterprise Architecture Diagrams
Enterprise Architecture Diagrams solution extends ConceptDraw PRO software with templates, samples and library of vector stencils for drawing the diagrams of enterprise architecture models.
- | SmartAmerica Challenge - Timeline | Network Security Diagrams ...
- SmartAmerica Challenge - Timeline | Learn how to create a current ...
- Website Wireframe | Entity Relationship Diagram - ERD - Software ...
- How to Create a Timeline Diagram in ConceptDraw PRO | How to ...
- Entity Relationship Diagram - ERD - Software for Design Crows Foot ...
- Website Wireframe | Entity Relationship Diagram - ERD - Software ...
- Stakeholder Onion Diagrams | ConceptDraw Solution Park | Project ...
- Project Timeline | Gant Chart in Project Management | How to ...
- Process Flowchart | Basic Flowchart Symbols and Meaning | Data ...
- Credit Card Processing System UML Diagram | Processing Flow ...
- Atm Automation Sequence Diagram
- Land sales process flowchart | How to Create a Timeline Diagram in ...
- ConceptDraw Solution Park | Seating Plans | The Best Flowchart ...
- ConceptDraw Solution Park | Business diagrams & Org Charts with ...
- Basic Flowchart Symbols and Meaning | Flowchart Definition ...
- Website To Make A Graph
- Conceptdraw.com: Mind Map Software, Drawing Tools | Project ...
- ConceptDraw Solution Park | Management Area | Plant Layout Plans
- Launch Projects Exchanging Mind Maps with Evernote | Example ...
- How to Create a Social Media DFD Flowchart | Flow Chart Online ...