"A project plan, according to the Project Management Body of Knowledge, is: "...a formal, approved document used to guide both project execution and project control. The primary uses of the project plan are to document planning assumptions and decisions, facilitate communication among stakeholders, and document approved scope, cost, and schedule baselines. A project plan may be summarized or detailed." ...
The objective of a project plan is to define the approach to be used by the Project team to deliver the intended project management scope of the project.
At a minimum, a project plan answers basic questions about the project:
Why? - What is the problem or value proposition addressed by the project? Why is it being sponsored?
What? - What is the work that will be performed on the project? What are the major products/ deliverables?
Who? - Who will be involved and what will be their responsibilities within the project? How will they be organized?
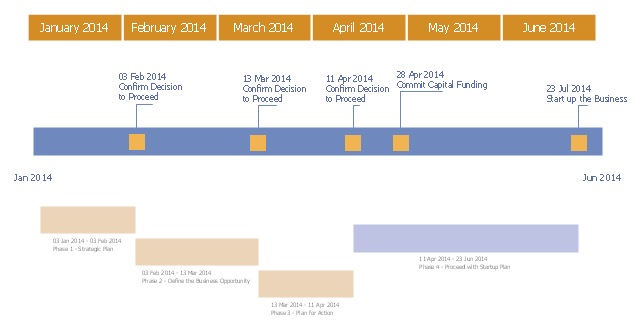
When? - What is the project timeline and when will particularly meaningful points, referred to as milestones, be complete?" [Project plan. Wikipedia]
The timeline diagram example "New business project plan" was created using the ConceptDraw PRO diagramming and vector drawing software extended with the Timeline Diagrams solution from the Management area of ConceptDraw Solution Park.
The objective of a project plan is to define the approach to be used by the Project team to deliver the intended project management scope of the project.
At a minimum, a project plan answers basic questions about the project:
Why? - What is the problem or value proposition addressed by the project? Why is it being sponsored?
What? - What is the work that will be performed on the project? What are the major products/ deliverables?
Who? - Who will be involved and what will be their responsibilities within the project? How will they be organized?
When? - What is the project timeline and when will particularly meaningful points, referred to as milestones, be complete?" [Project plan. Wikipedia]
The timeline diagram example "New business project plan" was created using the ConceptDraw PRO diagramming and vector drawing software extended with the Timeline Diagrams solution from the Management area of ConceptDraw Solution Park.
Project timeline
How to Make a Timeline

 Timeline Diagrams
Timeline Diagrams solution extends ConceptDraw DIAGRAM diagramming software with samples, templates and libraries of specially developed smart vector design elements of timeline bars, time intervals, milestones, events, today marker, legend, and many other elements with custom properties, helpful for professional drawing clear and intuitive Timeline Diagrams. Use it to design simple Timeline Diagrams and designate only the main project stages, or highly detailed Timeline Diagrams depicting all project tasks, subtasks, milestones, deadlines, responsible persons and other description information, ideal for applying in presentations, reports, education materials, and other documentation.
HelpDesk
How to Create a Timeline Diagram

Timeline Diagrams

 Management
This solution extends ConceptDraw DIAGRAM and ConceptDraw MINDMAP with Management Diagrams and Mind Maps (decision making, scheduling, thinking ideas, problem solving, business planning, company organizing, SWOT analysis, preparing and holding meetings
Project Timeline

Business diagrams & Org Charts with ConceptDraw DIAGRAM


Business Process Mapping — How to Map a Work Process

Timeline Examples

 Business Processes
Business Process solution extends ConceptDraw DIAGRAM software with business process diagrams as cross-functional flowcharts, workflows, process charts, IDEF0, timelines, calendars, Gantt charts, business process modeling, audit and opportunity flowcharts.
Examples of Flowcharts, Org Charts and More


HelpDesk
How To Create Cause and Effect (Fishbone) Diagram in MS Visio
 Diagram in MS Visio")
 ConceptDraw Solution Park
ConceptDraw Solution Park collects graphic extensions, examples and learning materials
- Project plan timeline - Request for proposal (RFP) | Timeline ...
- Timeline For Business Plan
- Project timeline diagram - New business project plan | How to Make ...
- Project timeline diagram - New business project plan | Project ...
- Timelines For Computer Business Plan
- Business Timelines
- Milestone Business Plan Examples
- Activity Network Diagram Method | Process Flowchart | Timeline ...
- Timeline Diagrams | Timeline diagram template | Project timeline ...
- Business diagrams & Org Charts with ConceptDraw PRO | Plant ...
- HVAC Business Plan | Bar Diagrams for Problem Solving. Create ...
- HVAC Business Plan | Event-driven Process Chain (EPC) Diagrams ...
- Sample Timelines
- Business diagrams & Org Charts with ConceptDraw PRO | Plant ...
- Timeline Diagrams | How to Make a Timeline | Timeline Diagrams ...
- Timeline Diagrams | Project timeline diagram - New business project ...
- Project Timeline | Timeline Examples | Timeline Diagrams | Project ...
- How to Create a Timeline Diagram in ConceptDraw PRO | Business ...
- Project timeline diagram - New business project plan | Project plan ...
- Project plan timeline - Request for proposal (RFP) | PERT chart ...