Time - Design Elements

Aircraft - Design Elements

"A chart can take a large variety of forms, however there are common features that provide the chart with its ability to extract meaning from data.
Typically the data in a chart is represented graphically, since humans are generally able to infer meaning from pictures quicker than from text. Text is generally used only to annotate the data.
One of the more important uses of text in a graph is the title. A graph's title usually appears above the main graphic and provides a succinct description of what the data in the graph refers to.
Dimensions in the data are often displayed on axes. If a horizontal and a vertical axis are used, they are usually referred to as the x-axis and y-axis respectively. Each axis will have a scale, denoted by periodic graduations and usually accompanied by numerical or categorical indications. Each axis will typically also have a label displayed outside or beside it, briefly describing the dimension represented. If the scale is numerical, the label will often be suffixed with the unit of that scale in parentheses. ...
Within the graph a grid of lines may appear to aid in the visual alignment of data. The grid can be enhanced by visually emphasizing the lines at regular or significant graduations. The emphasized lines are then called major grid lines and the remainder are minor grid lines.
The data of a chart can appear in all manner of formats, and may include individual textual labels describing the datum associated with the indicated position in the chart. The data may appear as dots or shapes, connected or unconnected, and in any combination of colors and patterns. Inferences or points of interest can be overlaid directly on the graph to further aid information extraction.
When the data appearing in a chart contains multiple variables, the chart may include a legend (also known as a key). A legend contains a list of the variables appearing in the chart and an example of their appearance. This information allows the data from each variable to be identified in the chart." [Chart. Wikipedia]
The vector stencils library "Time series charts" contains 10 templates: 3 column charts, 3 bar charts, 2 line graphs and 2 dot plots. All these charts are Live Objects displaying the data from external data source files.
Use these chart templates to design your business performance digital dashboards using the ConceptDraw PRO diagramming and vector drawing software.
The example "Design elements - Time series charts" is included in the Time Series Dashboard solution from the area "What is a Dashboard" of ConceptDraw Solution Park.
Time series charts

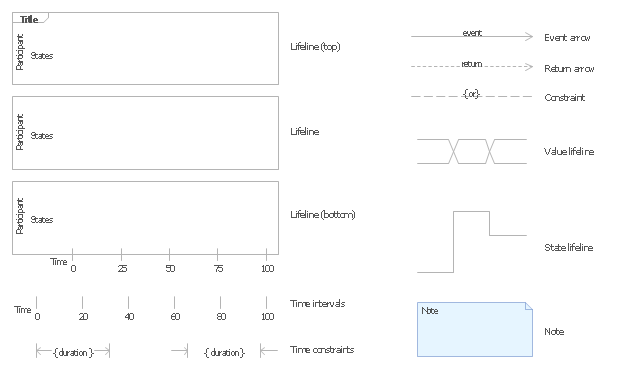
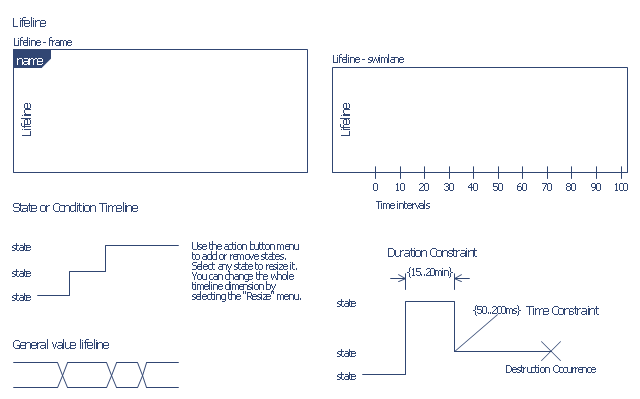
The vector stencils library "UML timing diagrams" contains 15 symbols for the ConceptDraw PRO diagramming and vector drawing software.
"The following nodes and edges are typically drawn in a UML timing diagram: lifeline, state or condition timeline, destruction event, duration constraint, time constraint. ...
Lifeline is a named element which represents an individual participant in the interaction. ... lifelines represent only one interacting entity. ...
Lifeline on the timing diagrams is represented by the name of classifier or the instance it represents. It could be placed inside diagram frame or a "swimlane". ...
Timing diagram could show states of the participating classifier or attribute, or some testable conditions, such as a discrete or enumerable value of an attribute. ...
UML also allows the state/ condition dimension be continuous. It could be used in scenarios where entities undergo continuous state changes, such as temperature or density. ...
Destruction occurrence is a message occurrence which represents the destruction of the instance described by the lifeline. It may result in the subsequent destruction of other objects that this object owns by composition. No other occurrence may appear after the destruction event on a given lifeline.
Complete UML name of the occurrence is destruction occurrence specification. Until UML 2.4 it was called destruction event, and earlier - stop.
The destruction event is depicted by a cross in the form of an X at the end of a timeline. ...
Duration constraint is an interval constraint that refers to a duration interval. The duration interval is duration used to determine whether the constraint is satisfied.
The semantics of a duration constraint is inherited from constraints. If constraints are violated, traces become negative which means that system is considered as failed.
Duration constraint is shown as some graphical association between a duration interval and the constructs that it constrains. ...
Time constraint is an interval constraint that refers to a time interval. The time interval is time expression used to determine whether the constraint is satisfied.
The semantics of a time constraint is inherited from constraints. All traces where the constraints are violated are negative traces, i.e., if they occur, the system is considered as failed.
Time constraint is shown as graphical association between a time interval and the construct that it constrains. Typically this graphical association is a small line, e.g., between an occurrence specification and a time interval." [uml-diagrams.org/ timing-diagrams.html]
The example "Design elements - UML timing diagrams" is included in the Rapid UML solution from the Software Development area of ConceptDraw Solution Park.
UML timing diagram symbols
UML Timing Diagram, Design Elements

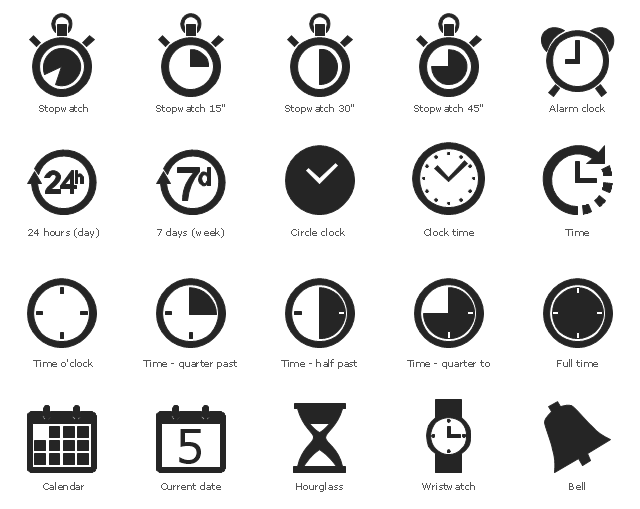
The vector stencils library "Time and clock pictograms" contains 20 time pictograms: clocks, calendars, day, week, bell, alarm clock, hourglass, wristwatch, and time intervals symbols.
Use it to create temporal infographic, illustrations and diagrams.
The pictograms example "Design elements - Time and clock pictograms" was created using the ConceptDraw PRO diagramming and vector drawing software extended with the Pictorial Infographic solution from the area "What is infographics" in ConceptDraw Solution Park.
Temporal pictograms
Project management - Design Elements

The vector stencils library "Time" contains 20 time and clock icons.
Use it to design your business and finance illustrations and infographics with ConceptDraw PRO diagramming and vector drawing software.
"Time management is the act or process of planning and exercising conscious control over the amount of time spent on specific activities, especially to increase effectiveness, efficiency or productivity.
It is a meta-activity with the goal to maximize the overall benefit of a set of other activities within the boundary condition of a limited amount of time.
Time management may be aided by a range of skills, tools, and techniques used to manage time when accomplishing specific tasks, projects, and goals complying with a due date." [Time management. Wikipedia]
The icon set example "Design elements - Time" is included in the Business and Finance solution from Illustration area of ConceptDraw Solution Park.
Icon set
Building Drawing Software for Design Piping Plan


Money - Design Elements

Design Elements for UML Diagrams

Building Drawing Software for Design Registers, Drills and Diffusers

The vector stencils library "Bank UML timing diagram" contains 8 shapes for drawing UML timing diagrams.
Use it for object-oriented modeling of your bank information system.
"A timing diagram in the Unified Modeling Language 2.0 is a specific type of interaction diagram, where the focus is on timing constraints.
Timing diagrams are used to explore the behaviors of objects throughout a given period of time. A timing diagram is a special form of a sequence diagram. The differences between timing diagram and sequence diagram are the axes are reversed so that the time is increased from left to right and the lifelines are shown in separate compartments arranged vertically.
There are two basic flavors of timing diagram: the concise notation, and the robust notation." [Timing diagram. Wikipedia]
This example of UML timing diagram symbols for the ConceptDraw PRO diagramming and vector drawing software is included in the ATM UML Diagrams solution from the Software Development area of ConceptDraw Solution Park.
UML timing diagram symbols
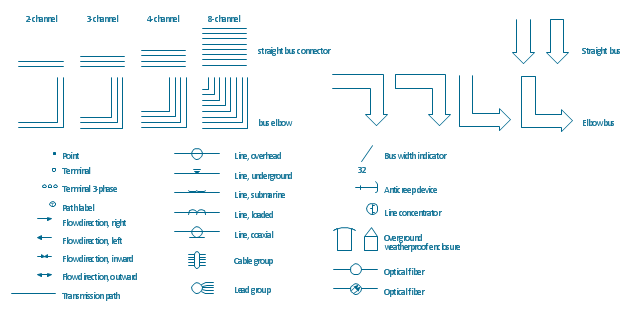
The vector stencils library "Transmission paths" contains 43 symbols of power transmission paths, electronic circuits, bus connectors and elbows, terminals, junctions, and concentrators.
Use it to annotate electrical diagrams, electronic schematics and circuit diagrams.
"A physical medium in data communications is the transmission path over which a signal propagates.
Many transmission media are used as communications channel.
For telecommunications purposes in the United States, Federal Standard 1037C, transmission media are classified as one of the following:
(1) Guided (or bounded) - waves are guided along a solid medium such as a transmission line.
(2) Wireless (or unguided) - transmission and reception are achieved by means of an antenna.
One of the most common physical medias used in networking is copper wire. Copper wire to carry signals to long distances using relatively low amounts of power. The unshielded twisted pair (UTP) is eight strands of copper wire, organized into four pairs.
Another example of a physical medium is optical fiber, which has emerged as the most commonly used transmission medium for long-distance communications. Optical fiber is a thin strand of glass that guides light along its length.
Multimode and single mode are two types of commonly used optical fiber. Multimode fiber uses LEDs as the light source and can carry signals over shorter distances, about 2 kilometers. Single mode can carry signals over distances of tens of miles.
Wireless media may carry surface waves or skywaves, either longitudinally or transversely, and are so classified.
In both communications, communication is in the form of electromagnetic waves. With guided transmission media, the waves are guided along a physical path; examples of guided media include phone lines, twisted pair cables, coaxial cables, and optical fibers. Unguided transmission media are methods that allow the transmission of data without the use of physical means to define the path it takes. Examples of this include microwave, radio or infrared. Unguided media provide a means for transmitting electromagnetic waves but do not guide them; examples are propagation through air, vacuum and seawater.
The term direct link is used to refer to the transmission path between two devices in which signals propagate directly from transmitters to receivers with no intermediate devices, other than amplifiers or repeaters used to increase signal strength. This term can apply to both guided and unguided media.
A transmission may be simplex, half-duplex, or full-duplex.
In simplex transmission, signals are transmitted in only one direction; one station is a transmitter and the other is the receiver. In the half-duplex operation, both stations may transmit, but only one at a time. In full duplex operation, both stations may transmit simultaneously. In the latter case, the medium is carrying signals in both directions at same time." [Transmission medium. Wikipedia]
The shapes example "Design elements - Transmission paths" was drawn using the ConceptDraw PRO diagramming and vector drawing software extended with the Electrical Engineering solution from the Engineering area of ConceptDraw Solution Park.
Transmission path symbols
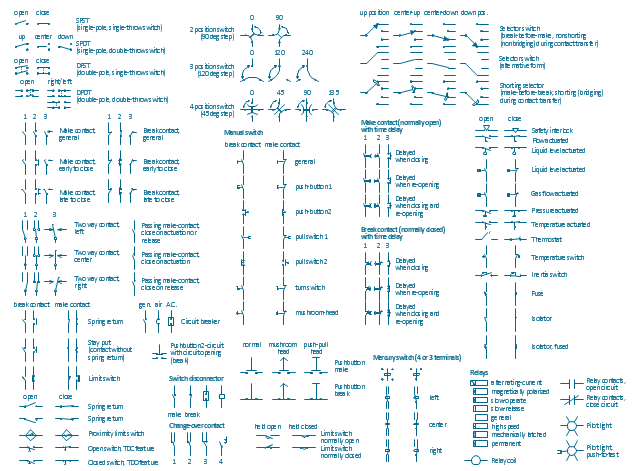
The vector stencils library "Switches and relays" contains 58 symbols of electrical contacts, switches, relays, circuit breakers, selectors, connectors, disconnect devices, switching circuits, current regulators, and thermostats for electrical devices.
"In electrical engineering, a switch is an electrical component that can break an electrical circuit, interrupting the current or diverting it from one conductor to another.
The most familiar form of switch is a manually operated electromechanical device with one or more sets of electrical contacts, which are connected to external circuits. Each set of contacts can be in one of two states: either "closed" meaning the contacts are touching and electricity can flow between them, or "open", meaning the contacts are separated and the switch is nonconducting. The mechanism actuating the transition between these two states (open or closed) can be either a "toggle" (flip switch for continuous "on" or "off") or "momentary" (push-for "on" or push-for "off") type.
A switch may be directly manipulated by a human as a control signal to a system, such as a computer keyboard button, or to control power flow in a circuit, such as a light switch. Automatically operated switches can be used to control the motions of machines, for example, to indicate that a garage door has reached its full open position or that a machine tool is in a position to accept another workpiece. Switches may be operated by process variables such as pressure, temperature, flow, current, voltage, and force, acting as sensors in a process and used to automatically control a system. ... A switch that is operated by another electrical circuit is called a relay. Large switches may be remotely operated by a motor drive mechanism. Some switches are used to isolate electric power from a system, providing a visible point of isolation that can be padlocked if necessary to prevent accidental operation of a machine during maintenance, or to prevent electric shock." [Switch. Wikipedia]
"A relay is an electrically operated switch. Many relays use an electromagnet to mechanically operate a switch, but other operating principles are also used, such as solid-state relays. Relays are used where it is necessary to control a circuit by a low-power signal (with complete electrical isolation between control and controlled circuits), or where several circuits must be controlled by one signal. The first relays were used in long distance telegraph circuits as amplifiers: they repeated the signal coming in from one circuit and re-transmitted it on another circuit. Relays were used extensively in telephone exchanges and early computers to perform logical operations.
A type of relay that can handle the high power required to directly control an electric motor or other loads is called a contactor. Solid-state relays control power circuits with no moving parts, instead using a semiconductor device to perform switching. Relays with calibrated operating characteristics and sometimes multiple operating coils are used to protect electrical circuits from overload or faults; in modern electric power systems these functions are performed by digital instruments still called "protective relays"." [Relay. Wikipedia]
The shapes example "Design elements - Switches and relays" was drawn using the ConceptDraw PRO diagramming and vector drawing software extended with the Electrical Engineering solution from the Engineering area of ConceptDraw Solution Park.
Switch and relay symbols
- Time and clock pictograms - Vector stencils library | Time - Design ...
- Time - Design Elements | Time - Vector stencils library | Design ...
- Time - Design Elements | Design elements - Time | Road signs ...
- Time and clock pictograms - Vector stencils library | Time - Design ...
- Time - Design Elements | Simple Diagram Of A Watch Tower
- Aerospace and Transport | Aircraft - Design Elements | Time ...
- Time - Design Elements | Design elements - Transmission paths ...
- Time - Design Elements | Design elements - Time | Diagram On How ...
- Strategy Clock Template | Design Pictorial Infographics. Design ...
- Design elements - UML timing diagrams | Time and clock ...
- Interior Design Office Layout Plan Design Element | Flat design floor ...
- Design elements - Time series charts | Design elements ...
- Business People Clipart | Office - Design Elements | Business and ...
- Currency - Design Elements | Design elements - Currency and ...
- Time and clock pictograms - Vector stencils library | Design ...
- Currency - Design Elements | Money - Design Elements | Design ...
- Design elements - Time series charts
- Time Series Dashboard | Design elements - Time series charts ...
- Business People Clipart | Business People Figures | Advertising ...
- Design elements - Alarm and access control | Design elements ...