Pareto Chart
This sample shows the Pareto Chart of titanium investment casting defects. On the Pareto chart at the same time are displayed a bar graph and a line graph. The descending values are represented by the bars and the cumulative total values are represented by the line. Pareto charts are widely used in the areas of the quality improvement and the time management.                        
                            
                                 25 Typical Orgcharts
                                25 Typical Orgcharts                            


                            The 25 Typical Orgcharts solution contains powerful organizational structure and organizational management drawing tools, a variety of professionally designed organization chart and matrix organization structure samples, 25 templates based on various orga                        
                                            
                            
                                 Marketing Diagrams
                                Marketing Diagrams                            


                            Marketing Diagrams solution extends ConceptDraw DIAGRAM diagramming software with abundance of samples, templates and vector design elements intended for easy graphical visualization and drawing different types of Marketing diagrams and graphs, including Branding Strategies Diagram, Five Forces Model Diagram, Decision Tree Diagram, Puzzle Diagram, Step Diagram, Process Chart, Strategy Map, Funnel Diagram, Value Chain Diagram, Ladder of Customer Loyalty Diagram, Leaky Bucket Diagram, Promotional Mix Diagram, Service-Goods Continuum Diagram, Six Markets Model Diagram, Sources of Customer Satisfaction Diagram, etc. Analyze effectively the marketing activity of your company and apply the optimal marketing methods with ConceptDraw DIAGRAM software.                        
                                            
                            
                                 Scatter Diagrams
                                Scatter Diagrams                            


                            The Scatter Diagrams solution extends ConceptDraw DIAGRAM functionality with templates, samples, and a library of vector stencils that make construction of a Scatter Plot easy. The Scatter Chart Solution makes it easy to design attractive Scatter Diagrams used in various fields of science, work, and life activities. ConceptDraw DIAGRAM lets you enter the data to the table and construct the Scatter Plot Graph automatically according to these data.                        
                                            
                            
                                 Fishbone Diagrams
                                Fishbone Diagrams                            


                            The Fishbone Diagrams solution extends ConceptDraw DIAGRAM software with the ability to easily draw the Fishbone Diagrams (Ishikawa Diagrams) to clearly see the cause and effect analysis and also problem solving. The vector graphic diagrams produced using this solution can be used in whitepapers, presentations, datasheets, posters, and published technical material.                        
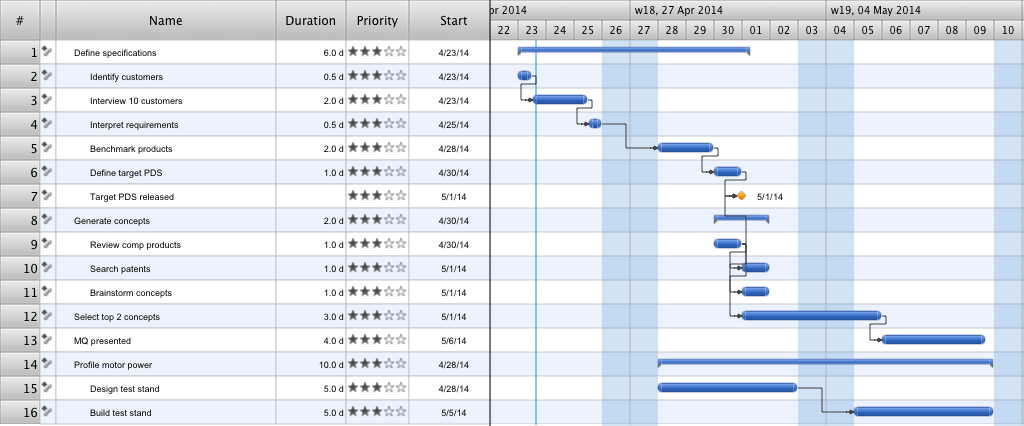
                    Project Timeline
Project timeline is a type of chart which allows visually represent the chronology of works for the project, placing the key points of the project (milestones) on a timescale. You need to make professional looking project timeline? Create it with ConceptDraw DIAGRAM ! ConceptDraw DIAGRAM extended with Timeline Diagrams Solution from the Management Area is the best timeline diagrams softwareGantt Chart Templates
Gantt Chart Templates - PM Easy Solution from the Project Management Area extends ConceptDraw PROJECT with the ability to quickly start a project. It lists task dependencies and relationships making the terative planning easy. ConceptDraw PROJECT lets you the useful possibility to create visual project dashboards and diagrams, generate various kinds of reports with one click. It provides also extensive capabilities of importing and exporting in various formats: Microsoft Project, ConceptDraw MINDMAP , Mindjet MindManager, PDF file.                        
                            
                                 Seven Management and Planning Tools
                                Seven Management and Planning Tools                            


                            Seven Management and Planning Tools solution extends ConceptDraw DIAGRAM and  ConceptDraw MINDMAP with features, templates, samples and libraries of vector stencils for drawing management mind maps and diagrams.                        
                    Fishbone Diagram Problem Solving
The Ishikawa diagram, Cause and Effect diagram, Fishbone diagram — all they are the names of one and the same visual method for working with causal connections. Originally invented by Kaoru Ishikawa to control the process quality, the Ishikawa diagram is well proven in other fields of management and personal scheduling, events planning, time management. It is a chart in the form of a fish, whose head is a problem, the fins are variants for its causes. To design easily the Fishbone diagram, you can use a special ConceptDraw DIAGRAM ector graphic and diagramming software which contains the powerful tools for Fishbone diagram problem solving offered by Fishbone Diagrams solution for the Management area of ConceptDraw Solution Park.Risk Diagram (Process Decision Program Chart)
The risk is a probable event in result of which may occur the negative events and adverse consequences. The risk management is a very important process in any field, it is a process of making the management decisions aimed on the reducing the likelihood of appearing the unfavorable results and on the minimizing potential losses, as well as the implementation of these solutions. The main purpose of applying the risk management is increasing of enterprise's competitiveness with help of protection against the risks. ConceptDraw MINDMAP software is perfect for identifying the risks, analyzing and managing risks, for designing Risk Diagrams, for developing effective actions in response to circumstances and potential obstacles that were identified as risks. It is also the best for designing Process Decision Program Charts and representing the PDPC method, which is effective way of detailed planning and depiction the whole sequence of actions on the path from the formulation a problem to its solution. The PDPC lets determine the risks when corrective actions are not performed correctly and helps develop descriptions for preventive actions.-  Schedule  pie  chart  - Daily action plan | Pie  Charts  |  Time  ...
-  Time Management  Circle  Graph 
-  Time Management  Tables And Pie  Charts 
-  Schedule  pie  chart  - Daily action plan |  Chart  Maker for ...
-  Time Management  Pie  Chart 
-  Time Management  Pie  Chart Template 
- Pie  Chart  For  Time Management 
-  Schedule  pie  chart  - Daily action plan | Bar  Diagrams  for Problem ...
-  Time Management  Table Or  Graph 
-  Schedule  pie  chart  - Daily action plan | Pareto  Chart  | Bar  Diagrams  ...


                            