 Cross-Functional Flowcharts
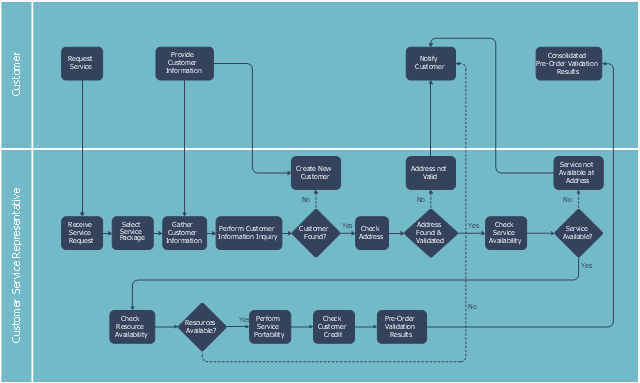
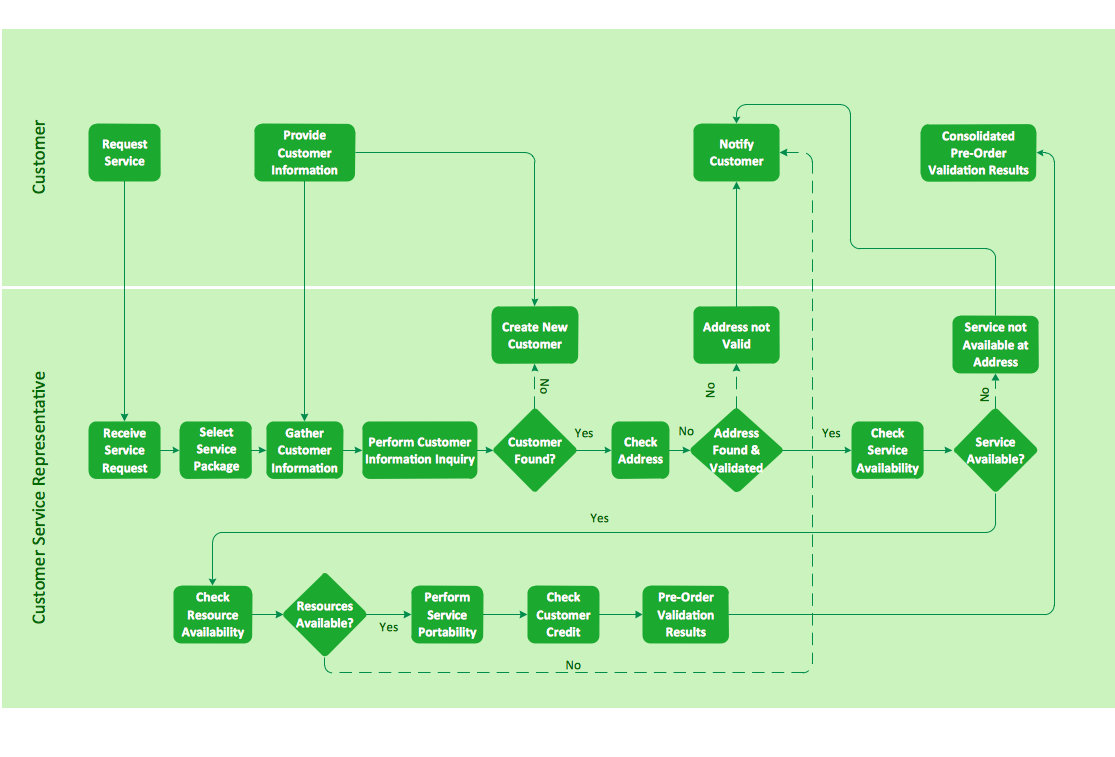
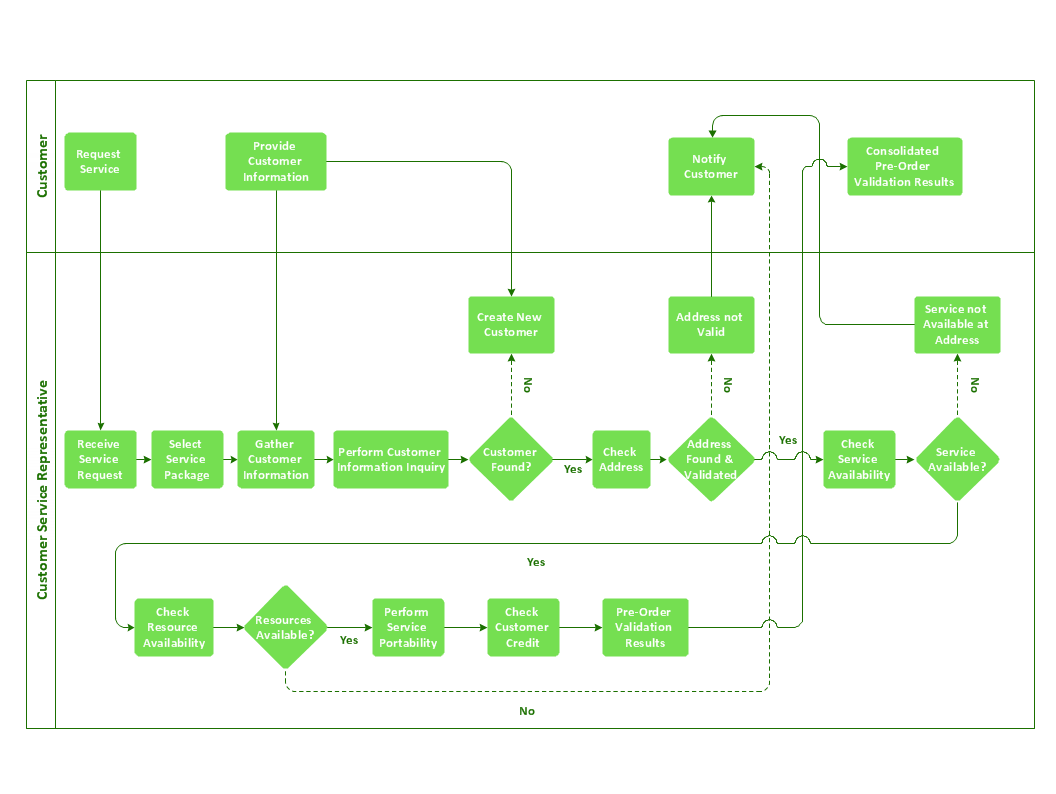
Cross-functional flowcharts are powerful and useful tool for visualizing and analyzing complex business processes which requires involvement of multiple people, teams or even departments. They let clearly represent a sequence of the process steps, the order of operations, relationships between processes and responsible functional units (such as departments or positions).
This swim lane diagram sample shows the telecom services process flow.
"Telecommunication is communication at a distance by technological means, particularly through electrical signals or electromagnetic waves. ...
Electrical and electromagnetic telecommunication technologies include telegraph, telephone, and teleprinter, networks, radio, microwave transmission, fiber optics, communications satellites and the Internet." [Telecommunication. Wikipedia]
"A telecommunications service provider or TSP is a type of communications service provider that has traditionally provided telephone and similar services. This category includes incumbent local exchange carriers, competitive local exchange carriers, and mobile wireless communication companies. ...
While some people use the terms "telecom service provider" and "communications service provider" interchangeably, the term TSP generally excludes Internet service providers (ISPs), cable companies, satellite TV, and managed service providers. ...
TSPs provide access to telephone and related communications services." [Telecommunications service provider. Wikipedia]
The cross-functional flowchart example "Providing telecom services" was created using the ConceptDraw PRO diagramming and vector drawing software extended with the Cross-Functional Flowcharts solution from the Business Processes area of ConceptDraw Solution Park.
Swin lane diagram
Business diagrams & Org Charts with ConceptDraw DIAGRAM


Cross-functional flowchart landscape, U.S. units
Cross-Functional Flowchart Basics

Create a Cross-Functional Flowchart
 Accounting Flowcharts
Accounting Flowcharts solution extends ConceptDraw DIAGRAM software with templates, samples and library of vector stencils for drawing the accounting flow charts.
 Universal Diagramming Area
This area collects solutions for drawing diagrams, charts, graphs, matrices, geographic and road maps for education, science, engineering, business.
ConceptDraw DIAGRAM

Applications

- Process Flowchart | Cross-functional flowchart - Providing telecom ...
- Cross-functional flowchart - Conceptdraw.com
- Cross-functional flowchart - Providing telecom services | Cross ...
- Cross-functional flowchart - Providing telecom services ...
- Telecommunication Network Diagrams | Cross-Functional ...
- Cross-functional flowchart - Providing telecom services | Cross ...
- Cross-functional flowchart - Providing telecom services | Flowchart ...
- Cross-functional flowchart landscape, U.S. units | Process Flowchart ...
- Cross-functional flowchart - Providing telecom services | Business ...
- Cross-Functional Flowchart - Conceptdraw.com
- Telecommunication Network Diagrams | Business Diagram Software ...
- Cross-functional flowchart - Providing telecom services
- Cross-Functional Flowchart
- Business process Flow Chart - Event-Driven Process chain (EPC)
- Diagramming Software for Design UML Communication Diagrams ...
- Business diagrams & Org Charts with ConceptDraw PRO | Electric ...
- How to Draw a Flowchart | Basic Flowchart Symbols | Opportunity ...
- Cross-Functional Flowcharts | Business Process Flowchart ...
- Cross-Functional Flowcharts | Cross Functional Flowchart Examples
- Cross-Functional Flowcharts | Business Processes | Cross ...