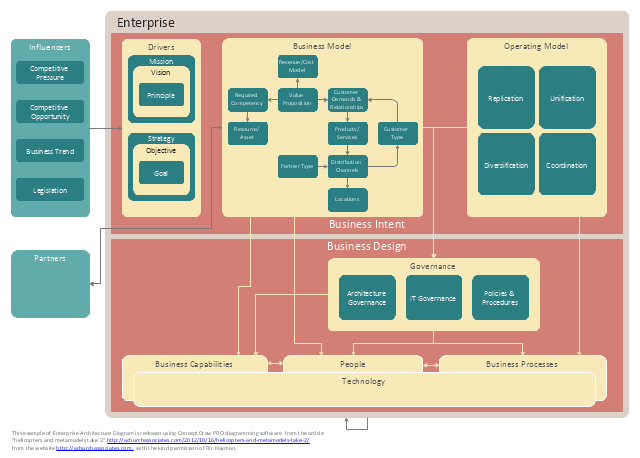
This enterprise architecture (EA) metamodel diagram example was redesigned from the illustration of article " helicopters and metamodels take 2".
"This is a “helicopter” level view – meant as a consulting and conversation guide for senior managers to help them place enterprise architecture appropriately in their strategic thinking."
www.achurchassociates.com/ 2012/ 10/ 16/ helicopters-and-metamodels-take-2/
from the website www.achurchassociates.com , with the kind permission of Ric Hayman.
The example "Enterprise architecture diagram" was created using the ConceptDraw PRO diagramming and vector drawing software extended with the Enterprise Architecture Diagrams solution from the Management area of ConceptDraw Solution Park.
Enterprise architecture metamodel diagram
Local area network (LAN). Computer and Network Examples
 diagram")

Competitor Analysis

 MindTweet
This solution extends ConceptDraw MINDMAP software with the ability to brainstorm, review and organize the sending of Tweets.
BCG Matrix

Create Organizational Chart

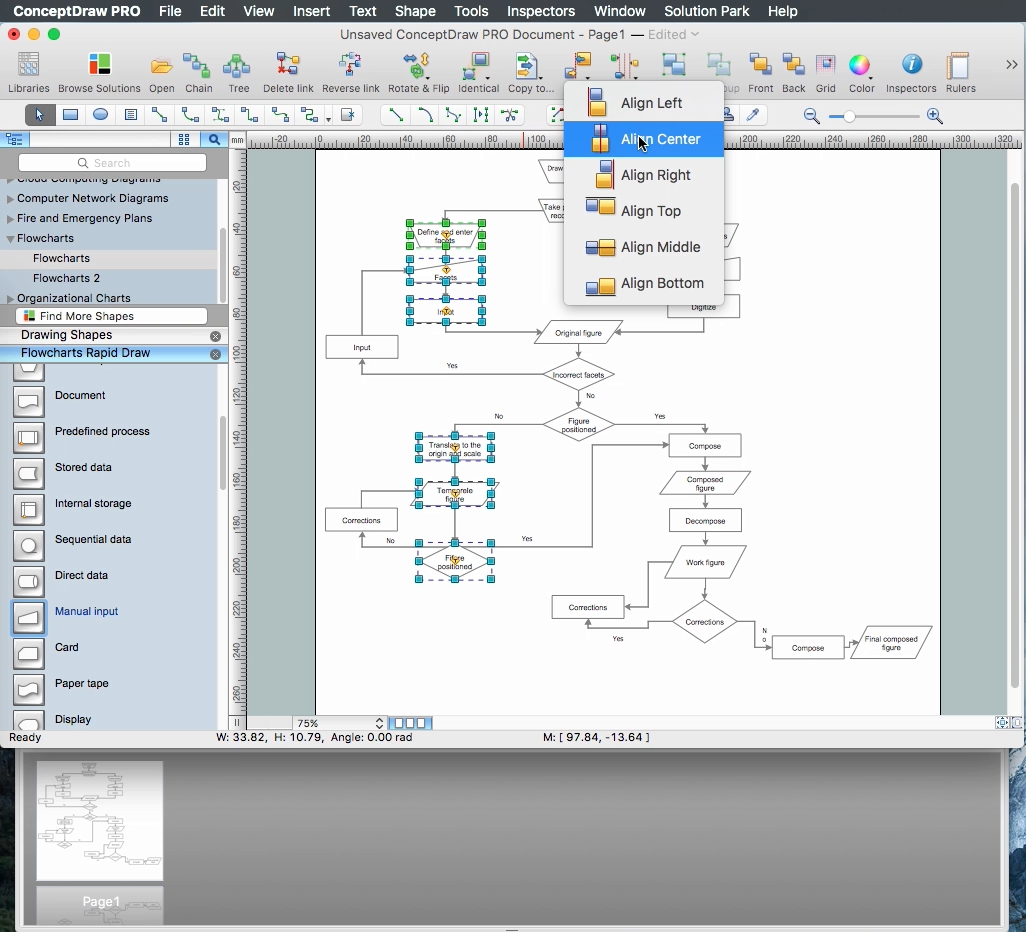
How to Build a Flowchart
Growth-Share Matrix Software

This sale dashboard example contains KPIs and sales effectiveness metrics visual indicators: speedometer gauge, dial, slider, level meter and bullet indicators.
"Sales effectiveness refers to the ability of a company’s sales professionals to “win” at each stage of the customer’s buying process, and ultimately earn the business on the right terms and in the right timeframe.
Improving sales effectiveness is not just a sales function issue; it’s a company issue, as it requires deep collaboration between sales and marketing to understand what’s working and not working, and continuous improvement of the knowledge, messages, skills, and strategies that sales people apply as they work sales opportunities.
Sales effectiveness has historically been used to describe a category of technologies and consulting services aimed at helping companies improve their sales results.
Many companies are creating sales effectiveness functions and have even given people titles such as VP of Sales Effectiveness." [Sales effectiveness. Wikipedia]
The example "Sales metrics and KPIs" was created using the ConceptDraw PRO diagramming and vector drawing software extended with the Meter Dashboard solution from the area "What is a Dashboard" of ConceptDraw Solution Park.
Sales dashboard

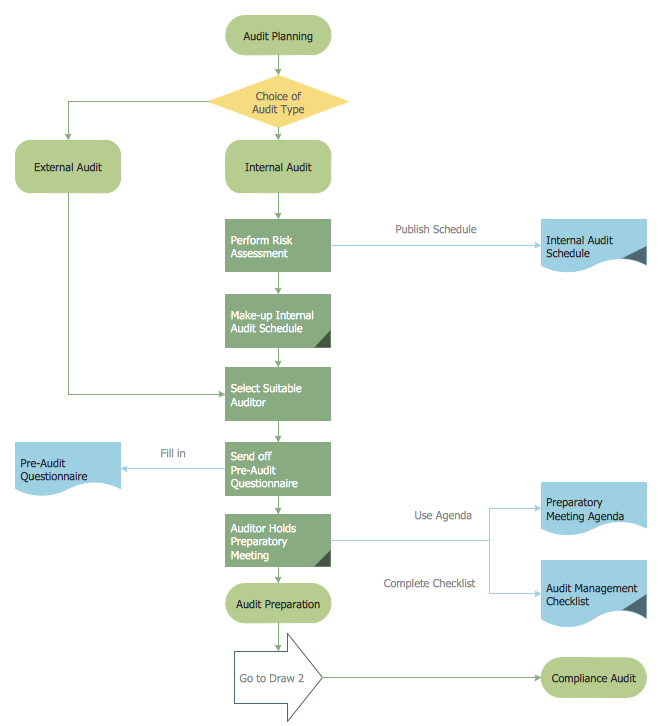
Auditing Process. Audit Planning Process
Matrix Organization Structure

HelpDesk
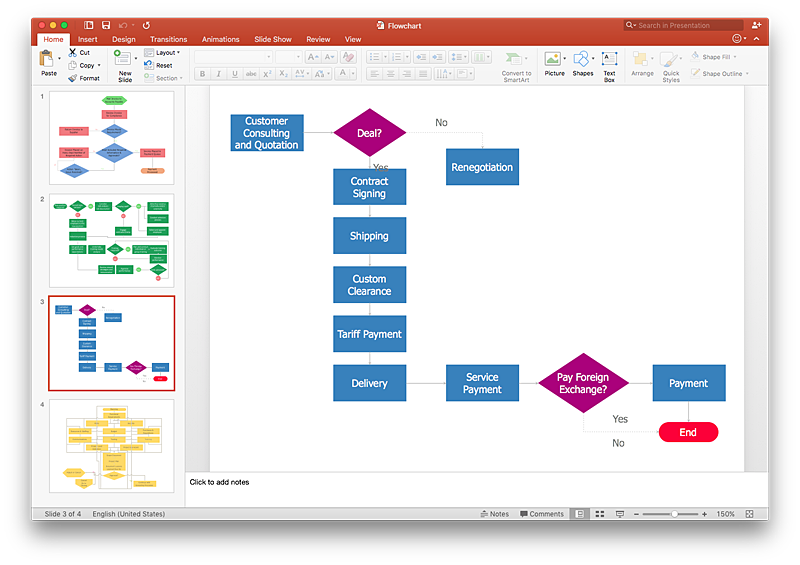
How To Make a PowerPoint Presentation of Flowcharts
Audit Process Flowchart. Audit Flowchart

- ConceptDraw | User Story
- Basic Flowchart Symbols and Meaning | ConceptDraw Arrows10 ...
- Enterprise Architecture Diagrams | Information Technology ...
- Consulting Powerpoint Slides Organisational Structure Alternatives
- Successful Strategic Plan | Project management - Design Elements ...
- Pyramid Diagram | Pyramid Diagram | Process Flowchart | Chart Of ...
- Import process - Flowchart | SWOT Analysis | Block diagram - Selling ...
- Enterprise Architecture Diagrams | Business Architecture ...
- Process Flowchart | Mechanical Drawing Symbols | Block diagram ...
- Enterprise architecture diagram
- 4 Level pyramid model diagram - Information systems types ...
- Vsm Excel Template
- Management Information System Triangle Diagram
- Basic Flowchart Symbols and Meaning | Process Flowchart ...
- Diagram Showing The Structure Of Information Technology In A
- Clipart Consulting Office
- Enterprise Architecture Diagrams | How to Create an Enterprise ...
- Process Management Consulting
- Information Technology Risk Vector Png
- Interior Design Office Layout Plan Design Element | ConceptDraw ...