This site uses cookies. By continuing to browse the ConceptDraw site you are agreeing to our Use of Site Cookies.

comparison chart, indicators Comparison Dashboard

comparison chart, indicators
Comparison dashboard solution extends ConceptDraw DIAGRAM software with samples, templates and vector stencils library with charts and indicators for drawing the visual dashboard comparing data.

Comparing ConceptDraw DIAGRAM to Omnigraffle

Comparing ConceptDraw DIAGRAM to Omnigraffle - Cross-platform product. While most drawing tools are designed for use on one operating system, ConceptDraw DIAGRAM is available as two independent and concurrent versions on both Macintosh (macOS) and PC (Windows).
License is per named user. That means you can use a single license for Macintosh and PC. Users can install at work and at home with a single license.

ConceptDraw DIAGRAM Comparison with Omnigraffle Professional and MS Visio

ConceptDraw DIAGRAM Comparison with Omnigraffle Professional and MS Visio. All source ConceptDraw documents are vector graphic documents. They are available for reviewing, modifying, or converting to a variety of formats: PDF file, MS PowerPoint, MS Visio, and many other graphics formats.

Competitor Analysis

Competitor analysis is a first and obligatory step in elaboration the proper corporate marketing strategy and creating sustainable competitive advantage. Use powerful opportunities of numerous solutions from ConceptDraw Solution Park for designing illustrative diagrams, charts, matrices which are necessary for effective competitor analysis.

Chart Software for Better Presentations

Easy charting software comes with beautiful chart templates and examples. This makes it easy to create professional charts without prior experience.
Graphs and Charts Area provide a wide collection of professional looking predesigned templates, samples and ready-to-use vector stencils that will help you to draw the charts and diagrams of various types: Pie Charts, Donut Charts, Line Charts, Column Charts, Bar Charts, Pyramids, Scatter Charts, Venn Diagrams, Spider Charts, Area Charts, Divided Bar Graphs.

Sales Growth. Bar Graphs Example

This sample was created in ConceptDraw DIAGRAM diagramming and vector drawing software using the Bar Graphs Solution from Graphs and Charts area of ConceptDraw Solution Park. It is Bar Graphs example, Sales Growth example, Column Chart Example - Sales Report.

Tools to Create Your Own Infographics

Over the past few centuries, data visualization has evolved so much that we use it every day in all areas of our lives. Many believe that infographic is an effective tool of storytelling, as well as analytics, and that it is able to overcome most of the language and educational barriers. Understanding the mechanisms of human perception will help you to understand how abstract forms and colors used in data visualization can transmit information more efficient than long paragraphs of text.

Beauty of Event-driven Process Chain (EPC) diagrams

Event-Driven Process Chain Diagrams for improvement throughout an organisation.
ConceptDraw DIAGRAM - software that reduces the time needed to create a business process model.

Biology Symbols

ConceptDraw DIAGRAM diagramming and vector drawing software extended with Biology solution from the Science and Education area offers a set of useful tools for fast and easy drawing of various biology illustrations and drawings.

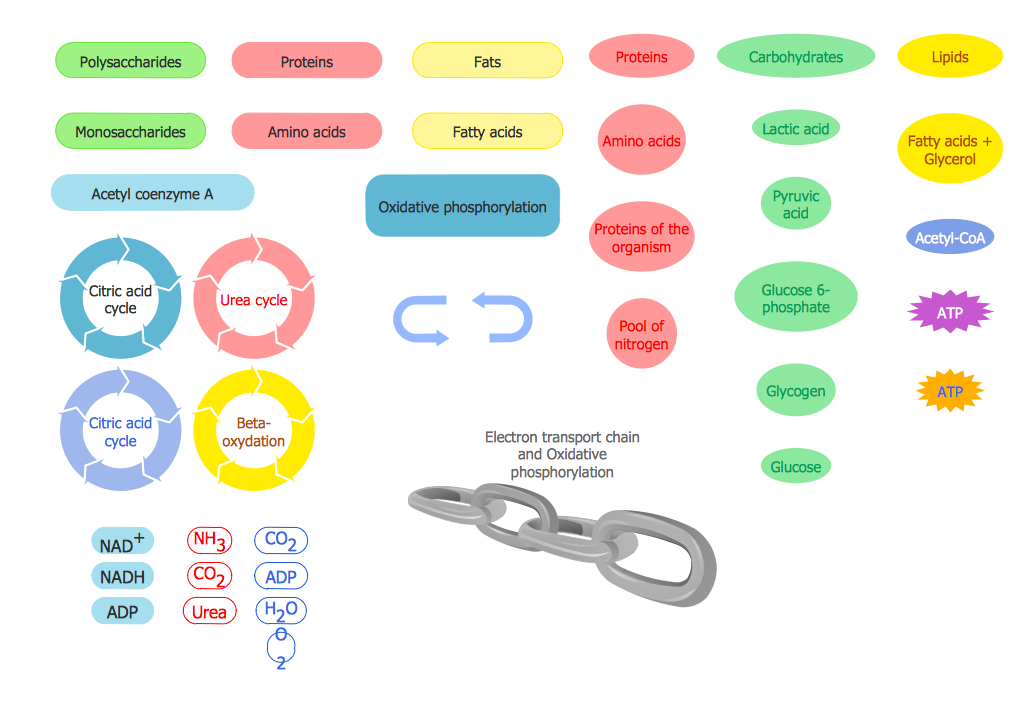
Biology solution provides 3 libraries with large quantity of vector biology symbols: Biochemistry of Metabolism Library, Carbohydrate Metabolism Library, Citric Acid Cycle (TCA Cycle) Library.

Deployment Chart Software

ConceptDraw DIAGRAM extended with Matrices solution from the Marketing area of ConceptDraw Solution Park is the best Deployment Chart Software.
The Matrices solution offers you the useful tools for creating Deployment Charts in just minutes.
The Deployment Charts designed with ConceptDraw DIAGRAM are vector graphic documents and are available for reviewing, modifying, converting to a variety of formats (image, HTML, PDF file, MS PowerPoint Presentation, Adobe Flash or MS Visio XML), printing and send via e-mail in one moment.