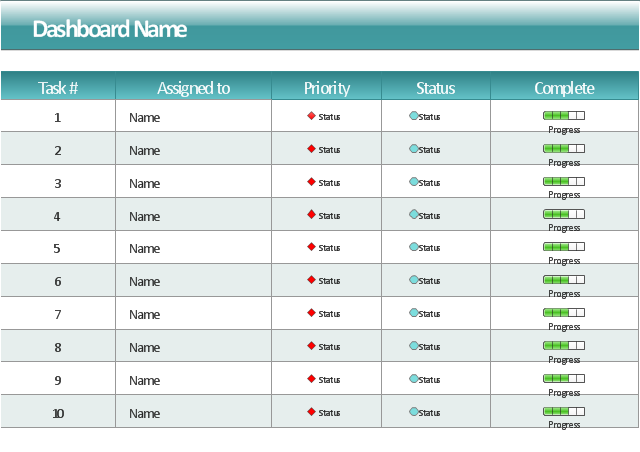
This project task status dashboard template display the task table consisting of the columns for task number, assignment (responsible person name), priority, status and complete. The task priority and status are indicated with alert visual indicators. The task complete is showed by progress indicators.
The template "Project task status dashboard" for the ConceptDraw PRO diagramming and vector drawing software is included in the Status Dashboard solution from the area "What is a Dashboard" of ConceptDraw Solution Park.
The template "Project task status dashboard" for the ConceptDraw PRO diagramming and vector drawing software is included in the Status Dashboard solution from the area "What is a Dashboard" of ConceptDraw Solution Park.
Project task status dashboard template
 Status Dashboard
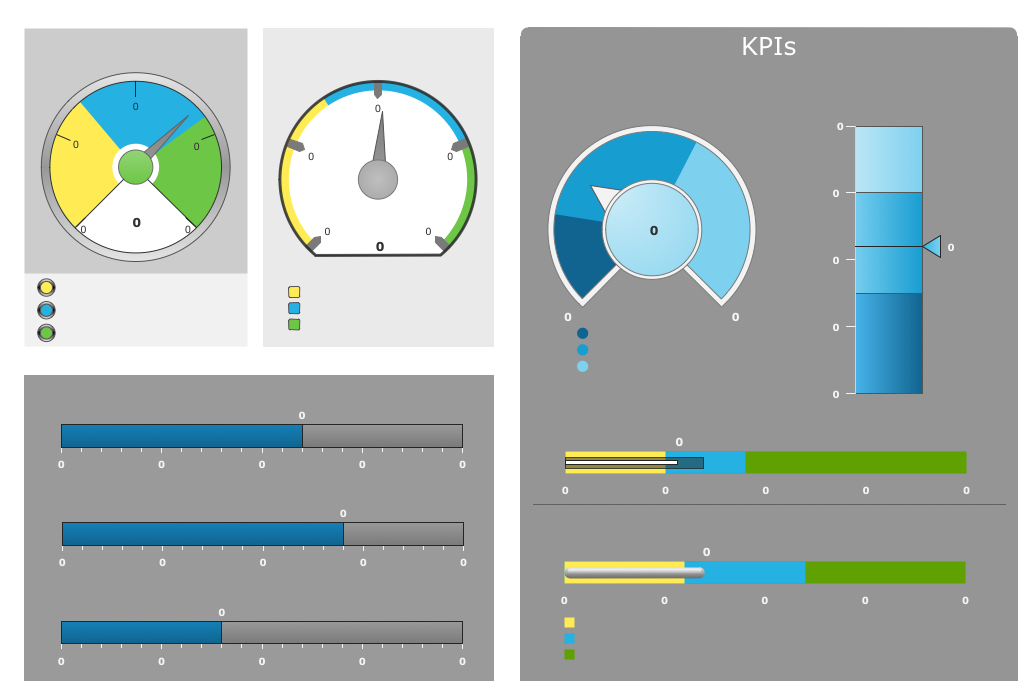
Status dashboard solution extends ConceptDraw DIAGRAM software with templates, samples and vector stencils libraries with graphic indicators for drawing the visual dashboards showing status data.
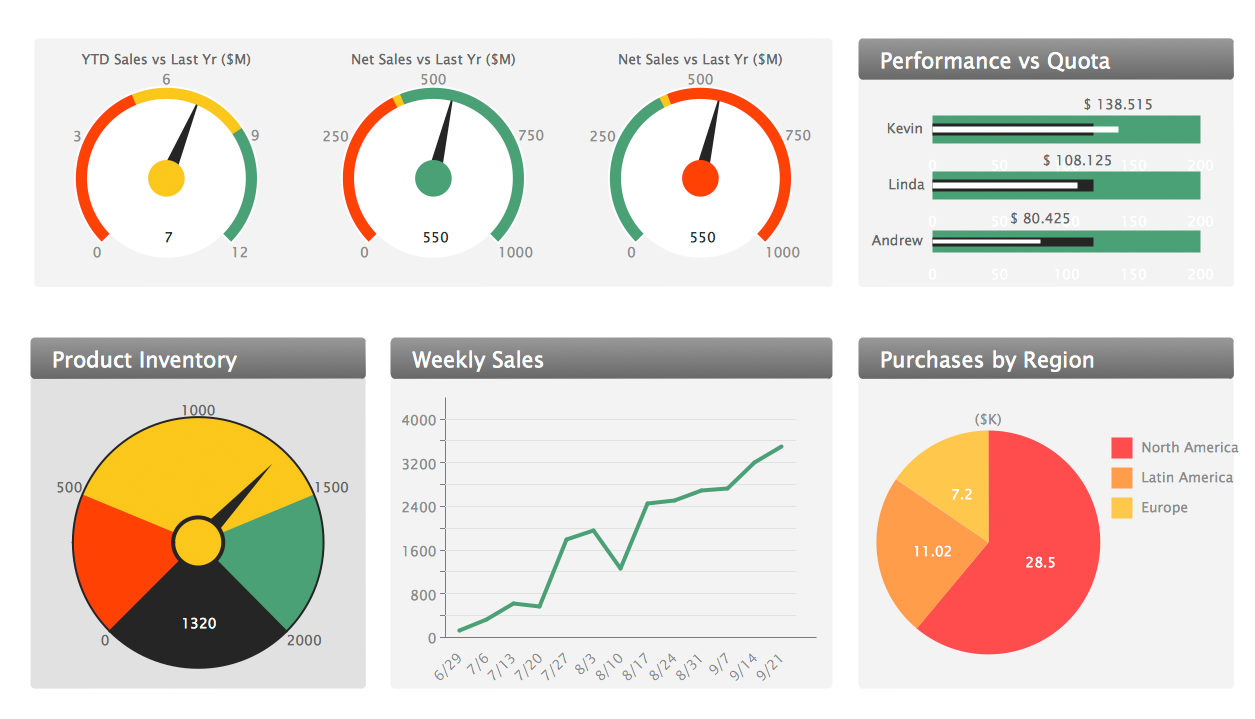
Sales Dashboard Solutions can help your sales team keep an eye on performance
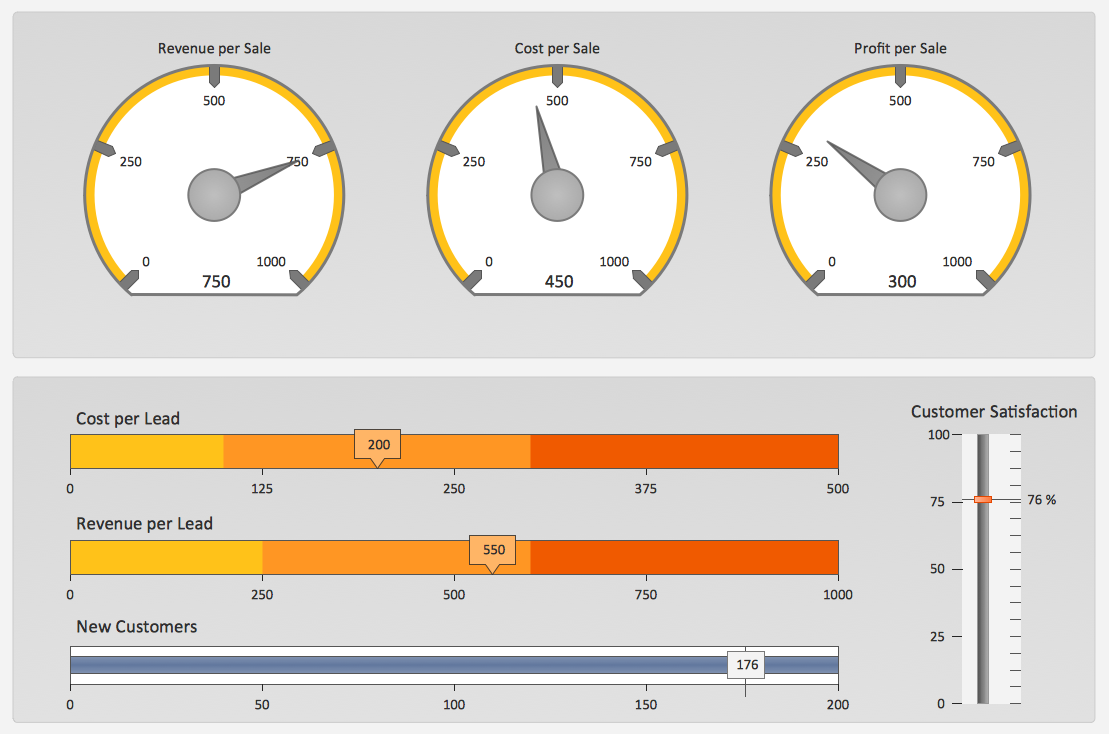
Empower Your Sales Team With a Sales Dashboard
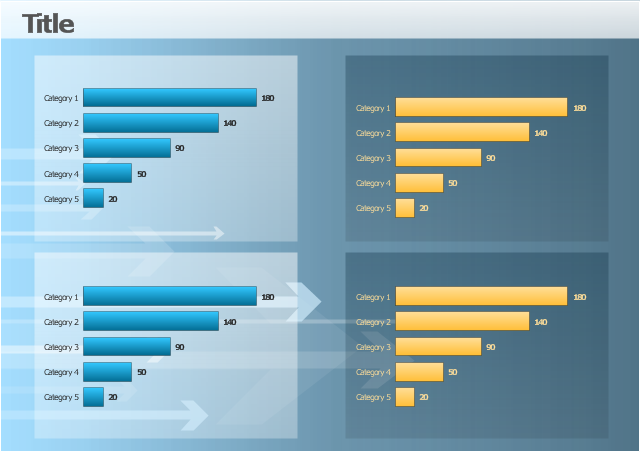
The template "Comparison dashboard" for the ConceptDraw PRO diagramming and vector drawing software is included in the Comparison Dashboard solution from the area "What is a Dashboard" of ConceptDraw Solution Park.
Visual dashboard template
 Timeline Diagrams
Timeline Diagrams solution extends ConceptDraw DIAGRAM diagramming software with samples, templates and libraries of specially developed smart vector design elements of timeline bars, time intervals, milestones, events, today marker, legend, and many other elements with custom properties, helpful for professional drawing clear and intuitive Timeline Diagrams. Use it to design simple Timeline Diagrams and designate only the main project stages, or highly detailed Timeline Diagrams depicting all project tasks, subtasks, milestones, deadlines, responsible persons and other description information, ideal for applying in presentations, reports, education materials, and other documentation.
Data Visualization Solutions

KPIs and Metrics

Sales Dashboard - insight about potential opportunities and key sales operations

Sales Dashboard
- Project management task status dashboard | Project task status ...
- Project task status dashboard - Template | Status Dashboard | PM ...
- Status Dashboard | Project task status dashboard | Project ...
- Status Dashboard | Project task status dashboard - Template | PM ...
- Project task status dashboard - Template | Status Dashboard ...
- Project task status dashboard - Template
- Project task status dashboard - Template | | How To Create Project ...
- Project task status dashboard - Template | Sales Dashboard ...
- PM Dashboards | Project management task status dashboard ...
- Status Dashboard | Project task status dashboard - Template ...