Business diagrams & Org Charts with ConceptDraw DIAGRAM


 Target and Circular Diagrams
This solution extends ConceptDraw DIAGRAM software with samples, templates and library of design elements for drawing the Target and Circular Diagrams.
Competitor Analysis

Circular Diagram

"A target market is a group of customers that the business has decided to aim its marketing efforts and ultimately its merchandise towards. A well-defined target market is the first element to a marketing strategy. The marketing mix variables of product, place (distribution), promotion and price are the four elements of a marketing mix strategy that determine the success of a product in the marketplace." [Target market. Wikipedia]
"An onion diagram is a kind of chart that shows the dependencies among parts of an organization or process. The chart displays items in concentric circles, where the items in each ring depend on the items in the smaller rings. ...
The Onion Diagram is able to show layers of a complete system in a few circles. Each of the circles is able to represent a component that is dependent upon the component on the inside of it shown by the circle inside of it. The main concept of the diagram is shown by the center circle of the diagram. This chart is used due to the fact that it has a clear visual representation that is easy to read, and it has a strong visual impact." [Onion diagram. Wikipedia]
This onion diagram (target diagram) example "Target market" was created using the ConceptDraw PRO diagramming and vector drawing software extended with the Target and Circular Diagrams solution from the Marketing area of ConceptDraw Solution Park.
www.conceptdraw.com/ solution-park/ marketing-target-and-circular-diagrams
Onion diagram

ConceptDraw Arrows10 Technology
Sales Process Flowchart Symbols

 Organizational Charts
Organizational Charts solution extends ConceptDraw DIAGRAM software with samples, templates and library of vector stencils for drawing the org charts.
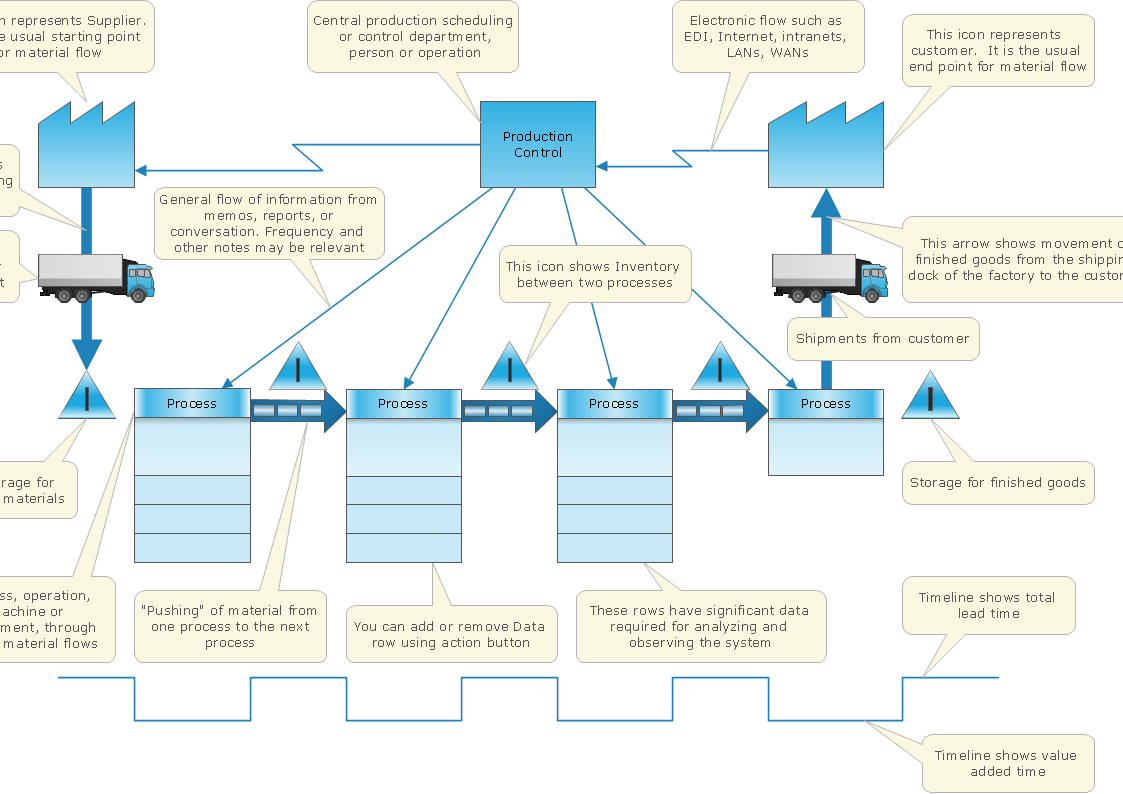
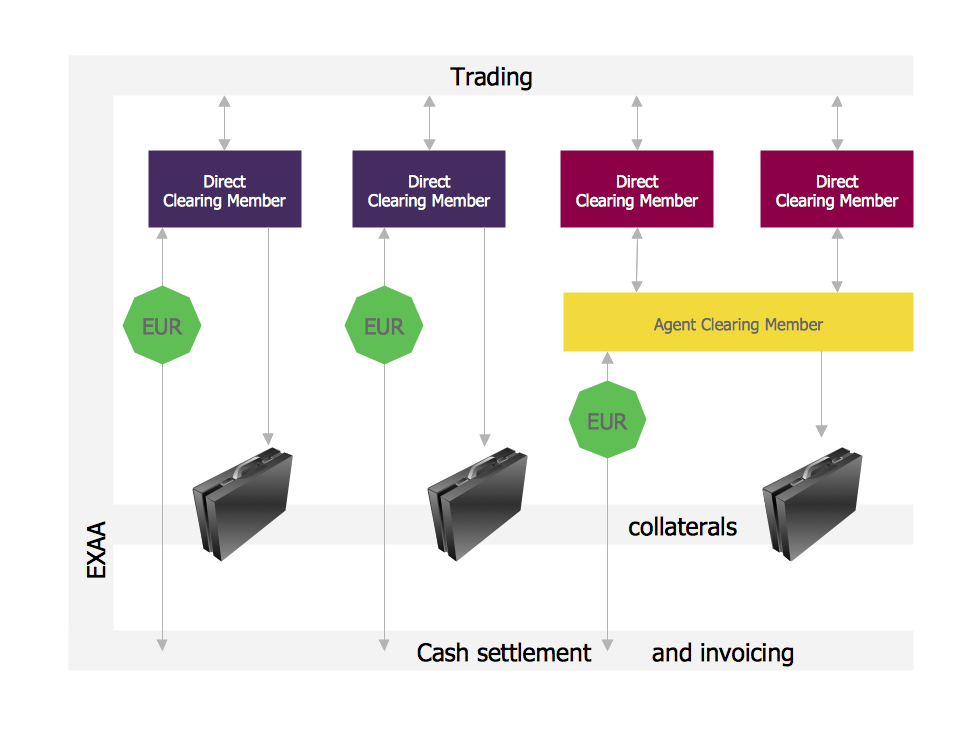
Settlement Process Flowchart. Flowchart Examples
Easy Flowchart Program and Standard Flowchart Symbols

- Target market - Onion diagram | Block Diagrams | Stakeholder ...
- How To Create a Visio Circle-Spoke Diagram Using ConceptDraw ...
- Example Circular Organizational Chart
- Circular Diagram | Target and Circular Diagrams | Circular Flow ...
- Daily Schedule Chart | Good Flow Chart app for Mac | Target ...
- Target Diagram | ConceptDraw Solution Park | UML Diagram Editor ...
- Schedule Flow Diagram Sample
- Target market - Onion diagram | Bubble diagrams in Landscape ...
- Target Diagram | Onion Diagram Process Design | Pie Chart Word ...