How To use House Electrical Plan Software


ERD Symbols and Meanings


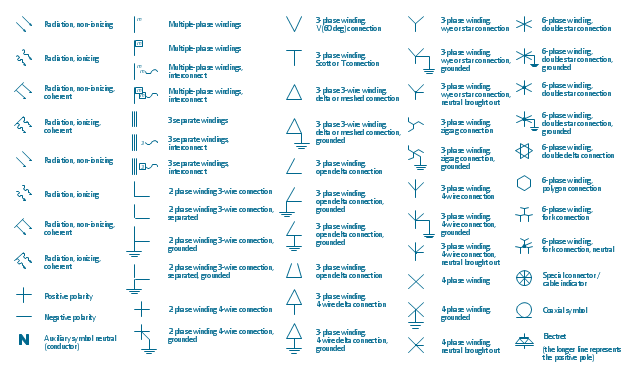
The vector stencils library "Qualifying" contains 56 qualifying symbols of radiation, polarity, phase, windings, wire, ground, connection, connector, coaxial, electret.
Use these signs to annotate or specify characteristics of objects in electrical drawings, electronic schematics, circuit diagrams, electromechanical drawings, and wiring diagrams, cabling layout diagrams.
"An electrical drawing, is a type of technical drawing that shows information about power, lighting, and communication for an engineering or architectural project. Any electrical working drawing consists of "lines, symbols, dimensions, and notations to accurately convey an engineering's design to the workers, who install the electrical system on the job".
A complete set of working drawings for the average electrical system in large projects usually consists of:
(1) A plot plan showing the building's location and outside electrical wiring.
(2) Floor plans showing the location of electrical systems on every floor.
(3) Power-riser diagrams showing panel boards.
(4) Control wiring diagrams.
(5) Schedules and other information in combination with construction drawings.
Electrical drafters prepare wiring and layout diagrams used by workers who erect, install, and repair electrical equipment and wiring in communication centers, power plants, electrical distribution systems, and buildings." [Electrical drawing. Wikipedia]
The signs example "Design elements - Qualifying" was drawn using the ConceptDraw PRO diagramming and vector drawing software extended with the Electrical Engineering solution from the Engineering area of ConceptDraw Solution Park.
Qualifying symbols
How To Create Restaurant Floor Plan in Minutes


Building Drawing Software for Design Office Layout Plan


 Entity-Relationship Diagram (ERD)
Entity-Relationship Diagram (ERD) solution extends ConceptDraw PRO software with templates, samples and libraries of vector stencils from drawing the ER-diagrams by Chen's and crow’s foot notations.
 Flowcharts
The Flowcharts solution for ConceptDraw PRO is a comprehensive set of examples and samples in several varied color themes for professionals that need to represent graphically a process. Solution value is added by the basic flow chart template and shapes' libraries of flowchart notation. ConceptDraw PRO flow chart creator lets one depict the processes of any complexity and length, as well as design the Flowchart either vertically or horizontally.
HelpDesk
How To Create an Involvement Matrix

 HR Flowcharts
Human resource management diagrams show recruitment models, the hiring process and human resource development of human resources.
HelpDesk
How To Create a PERT Chart

HelpDesk
How To Create Root Cause Analysis Diagram Using ConceptDraw Office

 Electric and Telecom Plans
This solution extends ConceptDraw PRO software with samples, templates and libraries of vector stencils for drawing the Electric and Telecom Plans.
- Mechanical Drawing Sign And Symbol
- Sign And Symbols For Mechanical Drawing
- Engineering Sign And Symbols
- How To use House Electrical Plan Software | How To Create ...
- Entity Relationship Diagram Symbols and Meaning ERD Symbols ...
- Electrical Drawing Software | How To use House Electrical Plan ...
- Mechanical Drawing Symbols | Basic Flowchart Symbols and ...
- Signs Used In Engineering Drawing
- Electrical Drawing Software | How To use House Electrical Plan ...
- Architectural Drawing Symbols
- Mechanical Drawing Symbols | Technical Drawing Software ...
- Mechanical Drawing Symbols | Technical Drawing Software ...
- Technical Drawing Electrical Engineering
- Mechanical Drawing Symbols | Basic Flowchart Symbols and ...
- Electrical Drawing Sign
- Mechanical Engineer Sign Or Symbols
- Symbol Of Architectural Engineering System
- Mechanical Drawing Symbols | Process Flow Diagram Symbols ...
- Sign Used In Mechanical Engg Drawing
- Chemical and Process Engineering | Mechanical Drawing Symbols ...