 SWOT Analysis
SWOT and TOWS Matrix Diagrams solution extends ConceptDraw DIAGRAM and ConceptDraw MINDMAP software with features, templates, samples and libraries of vector stencils for drawing SWOT and TOWS analysis matrices and mind maps.
How to Make SWOT Analysis in a Word Document

HelpDesk
How to Create SWOT Analysis Template

HelpDesk
How to Create a SWOT Matrix Quickly

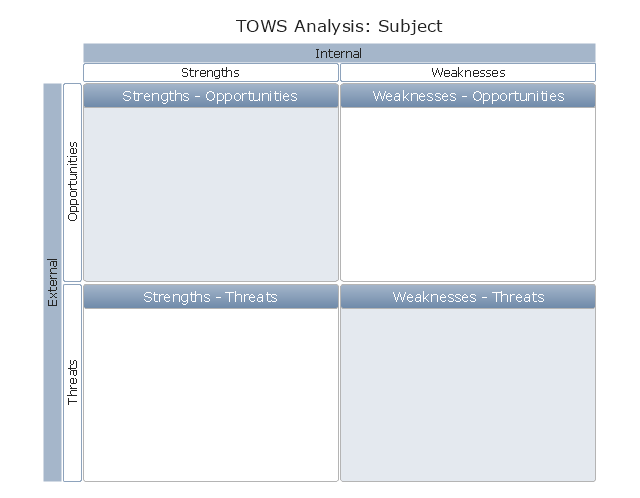
"The TOWS matrix ... serves as a conceptual framework for future research about the combination of external factors and those internal to the enterprise, and the strategies based on these variables.
Equally important, the matrix 'forces' practicing managers to analyze the situation of their company and to develop
strategies, tactics, and actions for the effective and efficient attainment of its organizational objectives and its mission." [usfca.edu/ fac_ staff/ weihrichh/ docs/ tows.pdf]
This TOWS analysis matrix diagram template for the ConceptDraw PRO diagramming and vector drawing software is included in the SWOT Analysis solution from the Management area of ConceptDraw Solution Park.
TOWS matrix template
 Entity-Relationship Diagram (ERD)
Entity-Relationship Diagram (ERD) solution extends ConceptDraw DIAGRAM software with templates, samples and libraries of vector stencils from drawing the ER-diagrams by Chen's and crow’s foot notations.
 Fishbone Diagram
Fishbone Diagrams solution extends ConceptDraw DIAGRAM software with templates, samples and library of vector stencils for drawing the Ishikawa diagrams for cause and effect analysis.
 Value Stream Mapping
Value stream mapping solution extends ConceptDraw DIAGRAM software with templates, samples and vector stencils for drawing the Value Stream Maps (VSM) in lean manufacturing practice.
HelpDesk
How to Use ConceptDraw Dashboard for Facebook on PC

HelpDesk
How to Make a Workflow Diagram

 Rapid UML
Rapid UML solution extends ConceptDraw DIAGRAM software with templates, samples and libraries of vector stencils for quick drawing the UML diagrams using Rapid Draw technology.
 Business Productivity Area
Business Productivity Solutions extend ConceptDraw products with tools for making presentations, conducting meetings, preparing documents, brainstorming, or building new strategies.
 Metro Map
Metro Map solution extends ConceptDraw DIAGRAM software with templates, samples and library of vector stencils for drawing the metro maps, route maps, bus and other transport schemes, or design tube-style infographics.
 Computers and Communications
Computers and communications solution extends ConceptDraw DIAGRAM software with illustration samples, templates and vector stencils libraries with clip art of computers, control devices, communications, technology, Apple machines.
 Area Charts
Area Charts are used to display the cumulative totals over time using numbers or percentages; or to show trends over time among related attributes. The Area Chart is effective when comparing two or more quantities. Each series of data is typically represented with a different color, the use of color transparency in an object’s transparency shows overlapped areas and smaller areas hidden behind larger areas.
 Audio and Video Connectors
Audio and video connectors solution extends ConceptDraw DIAGRAM software with templates, samples and library of vector stencils for drawing audio and video hook up diagrams.
 Continent Maps
Continent Maps solution extends ConceptDraw DIAGRAM software with templates, samples and libraries of vector stencils for drawing the thematic maps of continents, state maps of USA and Australia.
HelpDesk
How to Draw a Floor Plan for Your Office

- SWOT Matrix Template
- TOWS analysis matrix diagram - Template | SWOT Analysis Solution ...
- SWOT Sample in Computers | SWOT Analysis | How to Make SWOT ...
- TOWS analysis matrix template | How to Make SWOT Analysis in a ...
- SWOT Analysis | TOWS analysis matrix template | Business ...
- SWOT Sample in Computers | SWOT Analysis | Fishbone Diagram |
- How to Make SWOT Analysis in a Word Document - Conceptdraw.com
- SWOT Analysis Solution - Strategy Tools | TOWS analysis matrix ...
- SWOT Analysis | SWOT Sample in Computers | Fishbone Diagram |
- SWOT Analysis | Computers and Communications | Cisco Network ...
- How to Make SWOT Analysis in a Word Document | Block diagram ...
- SWOT Analysis | Fishbone Diagram | Value Stream Mapping |
- How to Make SWOT Analysis in a Word Document - Conceptdraw.com
- SWOT analysis matrix diagram templates
- SWOT matrix template | New business opportunity SWOT analysis ...
- Export from ConceptDraw PRO Document to PDF (Adobe Acrobat®)
- How To Create Emergency Plans | SWOT analysis diagram ...
- Small business consultancy SWOT analysis matrix | SWOT analysis ...
- TOWS analysis matrix diagram - instructional sample | SWOT ...
- SWOT matrix template - Conceptdraw.com