SWOT Matrix Software

"A SWOT analysis is a subjective method used to evaluate the STRENGTHS, WEAKNESSES, OPPORTUNITIES, and THREATS involved in trying to attain an objective. It involves specifying the objective and identifying the internal and external factors that are favourable and unfavourable to achieving the objective. It can be used as a business tool or on a personal level where it can help you take advantage of your talents, abilities and opportunities. It can help to clarify and summarise the key issues and opportunities facing you and thereby to set objectives and develop new strategies. It should help you to to maximise strengths and minimise weaknesses in order to take advantage of opportunities and reduce threats." [kent.ac.uk/ careers/ sk/ decisionmaking.htm]
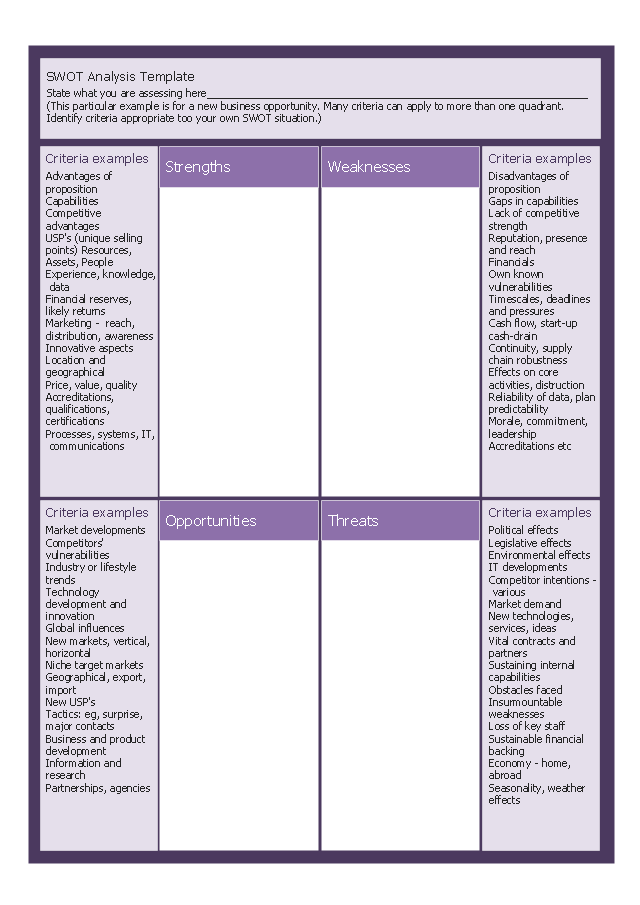
This form template "New business opportunity SWOT analysis matrix" for the ConceptDraw PRO diagramming and vector drawing software is included in the SWOT Analysis solution from the Management area of ConceptDraw Solution Park.
This form template "New business opportunity SWOT analysis matrix" for the ConceptDraw PRO diagramming and vector drawing software is included in the SWOT Analysis solution from the Management area of ConceptDraw Solution Park.
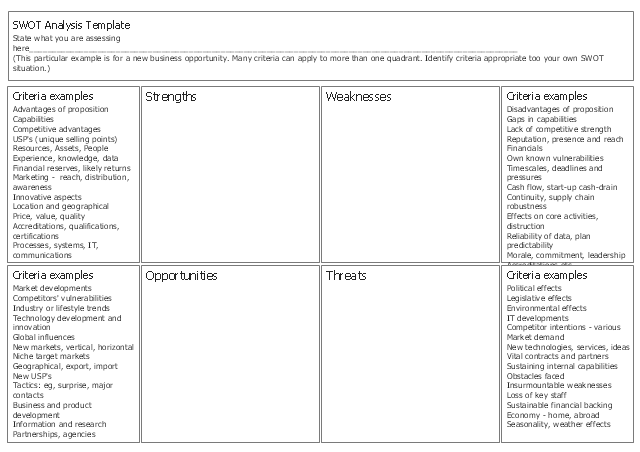
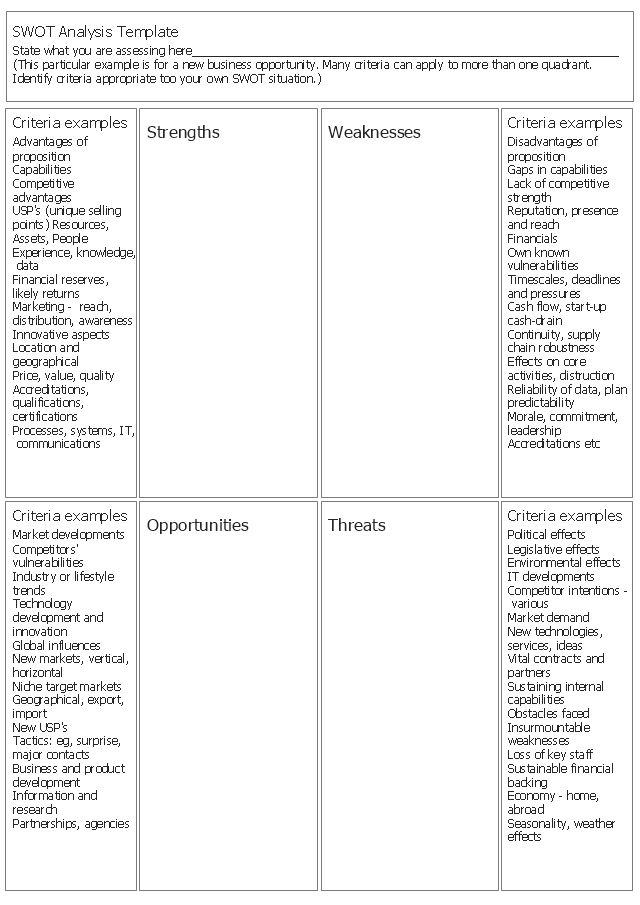
SWOT matrix template
How to Make SWOT Analysis in a Word Document

"SWOT Analysis.
A way to identify and analyze a company's goals by assessing its strength, weaknesses, opportunities, and threats. An advantage to SWOT analysis is that it separates internal factors (strengths and weaknesses) from external ones (opportunities and threats). This allows the company to match what it could do in theory with what is possible in reality. Another advantage is the fact that conducting SWOT analysis is straightforward if the company conducting it is honest with itself." [financial-dictionary.thefreedictionary.com/ SWOT+Analysis]
This form template "New business opportunity SWOT analysis matrix" for the ConceptDraw PRO diagramming and vector drawing software is included in the SWOT Analysis solution from the Management area of ConceptDraw Solution Park.
SWOT matrix template
"SWOT is a handy mnemonic to help corporate planners think about strategy. It stands for Strengths, Weaknesses, Opportunities and Threats. What are an organisation's SWOTs? How can it manage them in a way that will optimise its performance? A second four-letter acronym is sometimes brought into play here: USED. How can the Strengths be Used; the Weaknesses be Stopped, the Opportunities be Exploited; and the Threats be Defended against? ...
A SWOT analysis can be applied to different aspects of a company's business, such as its it capability or its skills. The simplicity and intuitive wholeness of the framework have helped to make it extremely popular with both corporations and governments." [economist.com/ node/ 14301503]
This form template "New business opportunity SWOT analysis matrix" for the ConceptDraw PRO diagramming and vector drawing software is included in the SWOT Analysis solution from the Management area of ConceptDraw Solution Park.
SWOT matrix template

"SWOT stands for Strengths, Weaknesses, Opportunities, and Threats. SWOT analysis is a tool for analyzing the current situation both internally (strengths and weaknesses) and externally (opportunities and threats). It provides helpful baseline information for a group that wants to vision the future or analyze a problem." [educationworld.com/ a_ admin/ greatmeetings/ greatmeetings018.shtml]
This form template "New business opportunity SWOT analysis matrix" for the ConceptDraw PRO diagramming and vector drawing software is included in the SWOT Analysis solution from the Management area of ConceptDraw Solution Park.
This form template "New business opportunity SWOT analysis matrix" for the ConceptDraw PRO diagramming and vector drawing software is included in the SWOT Analysis solution from the Management area of ConceptDraw Solution Park.
SWOT matrix template
HelpDesk
How to Create a PowerPoint Presentation from a SWOT Matrix

 ConceptDraw Solution Park
ConceptDraw Solution Park collects graphic extensions, examples and learning materials
Think. Act. Accomplish.

Human Resource Development

HelpDesk
How to Create a Bubble Diagram

Fishbone Diagram Template

HelpDesk
How to Reshape an Object Using Vertex Tool on Mac

HelpDesk
How to Add a Bubble Diagram to PowerPoint Presentation

 Entity-Relationship Diagram (ERD)
Entity-Relationship Diagram (ERD) solution extends ConceptDraw DIAGRAM software with templates, samples and libraries of vector stencils from drawing the ER-diagrams by Chen's and crow’s foot notations.
 Total Quality Management TQM Diagrams
Total Quality Management Diagrams solution extends ConceptDraw DIAGRAM software with samples, templates and vector stencils library for drawing the TQM flowcharts.
- SWOT Analysis | SWOT Analysis Solution - Strategy Tools | SWOT ...
- SWOT Matrix Template | SWOT Analysis Solution - Strategy Tools ...
- SWOT Analysis | New business opportunity SWOT analysis matrix ...
- Swot Analysis Examples | How to Make SWOT Analysis in a Word ...
- SWOT matrix template | New business opportunity SWOT analysis ...
- How to Make SWOT Analysis in a Word Document | SWOT Template ...
- SWOT Matrix Template | Matrices | How To Create the Involvement ...
- SWOT Matrix Template
- Swot Analysis Strengths, Weaknesses, Opportunities, and Threats ...
- Swot Analysis Strengths, Weaknesses, Opportunities, and Threats ...
- New business opportunity SWOT analysis matrix - Template ...
- SWOT analysis matrix - Template | Business Productivity Area ...
- New business opportunity SWOT analysis matrix - Template portrait ...
- SWOT analysis Software & Template for Macintosh and Windows ...
- SWOT Analysis | How to Create SWOT Analysis Template in ...
- SWOT Analysis Solution - Strategy Tools | SWOT Analysis | SWOT ...
- New business opportunity SWOT analysis matrix - Template portrait ...
- Swot Analysis For It Company
- Swot Analysis Strengths, Weaknesses, Opportunities, and Threats ...
- Mind Maps for Business - SWOT Analysis | SWOT Analysis | New ...