 SWOT Analysis
SWOT and TOWS Matrix Diagrams solution extends ConceptDraw DIAGRAM and ConceptDraw MINDMAP software with features, templates, samples and libraries of vector stencils for drawing SWOT and TOWS analysis matrices and mind maps.
How to Make SWOT Analysis in a Word Document

HelpDesk
How to Create SWOT Analysis Template

HelpDesk
How to Create a SWOT Matrix Quickly

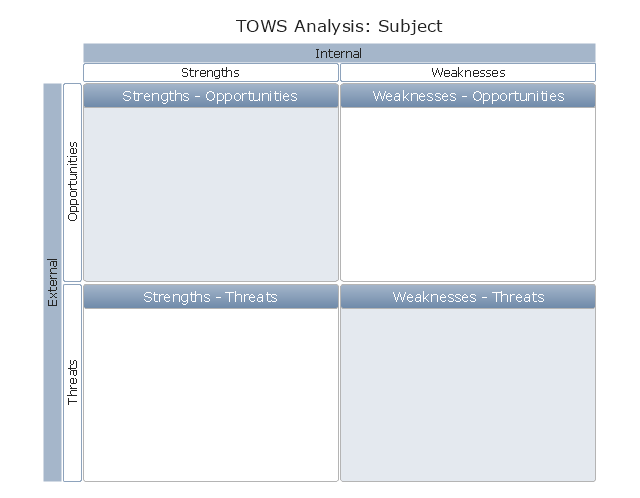
"The TOWS matrix ... serves as a conceptual framework for future research about the combination of external factors and those internal to the enterprise, and the strategies based on these variables.
Equally important, the matrix 'forces' practicing managers to analyze the situation of their company and to develop
strategies, tactics, and actions for the effective and efficient attainment of its organizational objectives and its mission." [usfca.edu/ fac_ staff/ weihrichh/ docs/ tows.pdf]
This TOWS analysis matrix diagram template for the ConceptDraw PRO diagramming and vector drawing software is included in the SWOT Analysis solution from the Management area of ConceptDraw Solution Park.
TOWS matrix template
 Fishbone Diagram
Fishbone Diagrams solution extends ConceptDraw DIAGRAM software with templates, samples and library of vector stencils for drawing the Ishikawa diagrams for cause and effect analysis.
 Business Productivity Area
Business Productivity Solutions extend ConceptDraw products with tools for making presentations, conducting meetings, preparing documents, brainstorming, or building new strategies.
 Value Stream Mapping
Value stream mapping solution extends ConceptDraw DIAGRAM software with templates, samples and vector stencils for drawing the Value Stream Maps (VSM) in lean manufacturing practice.
 Entity-Relationship Diagram (ERD)
Entity-Relationship Diagram (ERD) solution extends ConceptDraw DIAGRAM software with templates, samples and libraries of vector stencils from drawing the ER-diagrams by Chen's and crow’s foot notations.
 Fault Tree Analysis Diagrams
This solution extends ConceptDraw DIAGRAM.5 or later with templates, fault tree analysis example, samples and a library of vector design elements for drawing FTA diagrams (or negative analytical trees), cause and effect diagrams and fault tree diagrams.
 Seven Management and Planning Tools
Seven Management and Planning Tools solution extends ConceptDraw DIAGRAM and ConceptDraw MINDMAP with features, templates, samples and libraries of vector stencils for drawing management mind maps and diagrams.
 Continent Maps
Continent Maps solution extends ConceptDraw DIAGRAM software with templates, samples and libraries of vector stencils for drawing the thematic maps of continents, state maps of USA and Australia.
 Graphic User Interface
Graphic User Interface solution extends ConceptDraw DIAGRAM software with templates, samples and libraries of vector stencils for design of the GUI prototypes and diagrams for Windows, Mac OS and iOS software.
 Area Charts
Area Charts are used to display the cumulative totals over time using numbers or percentages; or to show trends over time among related attributes. The Area Chart is effective when comparing two or more quantities. Each series of data is typically represented with a different color, the use of color transparency in an object’s transparency shows overlapped areas and smaller areas hidden behind larger areas.
 Football
The Football Solution extends ConceptDraw DIAGRAM software with samples, templates, and libraries of vector objects for drawing football (American) diagrams, plays schemas, and illustrations. It can be used to make professional looking documen
 Holiday
The Holiday Solution from Illustration area of ConceptDraw Solution Park contains holiday illustration examples, templates and vector clipart library.
 Pie Charts
Pie Charts are extensively used in statistics and business for explaining data and work results, in mass media for comparison (i.e. to visualize the percentage for the parts of one total), and in many other fields. The Pie Charts solution for ConceptDraw DIAGRAM offers powerful drawing tools, varied templates, samples, and a library of vector stencils for simple construction and design of Pie Charts, Donut Chart, and Pie Graph Worksheets.
- SWOT Matrix Template
- SWOT Analysis Solution - Strategy Tools | TOWS analysis matrix ...
- TOWS analysis matrix diagram - Template | SWOT Analysis Solution ...
- SWOT Analysis | TOWS analysis matrix template | Business ...
- TOWS analysis matrix template | How to Make SWOT Analysis in a ...
- TOWS analysis matrix template | SWOT analysis matrix diagram ...
- SWOT Analysis | TOWS analysis matrix template | Marketing |
- SWOT matrix template | New business opportunity SWOT analysis ...
- How to Make SWOT Analysis in a Word Document - Conceptdraw.com
- SWOT analysis diagram template | SWOT analysis matrix diagram ...
- TOWS analysis matrix template
- How to Make SWOT Analysis in a Word Document | SWOT Analysis ...
- TOWS analysis matrix template | SWOT Analysis Solution - Strategy ...
- SWOT matrix template - Conceptdraw.com
- SWOT Analysis | Computers and Communications | Cisco Network ...
- Small business consultancy SWOT analysis matrix | SWOT analysis ...
- SWOT Analysis | Fishbone Diagram | Value Stream Mapping |
- Swot Analysis Strengths, Weaknesses, Opportunities, and Threats ...
- SWOT Analysis
- New business opportunity SWOT analysis matrix - Template ...