How to Make SWOT Analysis in a Word Document
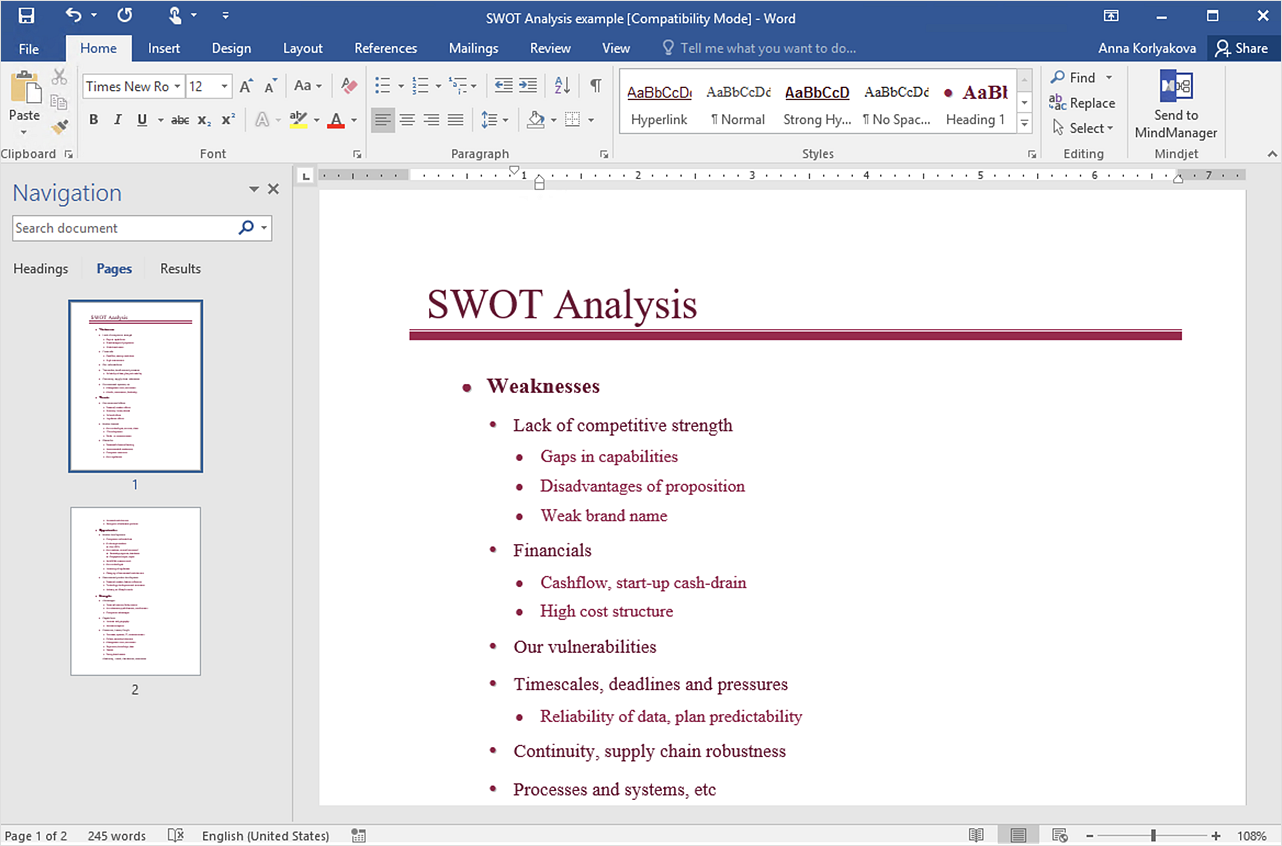
A SWOT Analysis is a popular tool of the strategic planning which is used to evaluate the Strengths, Weaknesses, Opportunities, and Threats that are involved in any businesses. Use of mind maps allows you to collect a lot of information used for SWOT Analysis, visually structure it and also identify the relationships between different parts of this information. SWOT and TOWS Matrix Diagrams solution for ConceptDraw Solution Park combines professional visual advantages of ConceptDraw MINDMAP software and presentation capabilities of ConceptDraw DIAGRAM , which together provide a complete work solution. The SWOT and TOWS diagrams, matrices or mind maps produced in ConceptDraw DIAGRAM using the predesigned vector objects or filling the ready templates, can be then easily exported to Microsoft Word, Microsoft Visio, Microsoft PowerPoint, Adobe PDF, and many other electronic file formats. The possibility of export makes easy the use of SWOT diagrams designed in ConceptDraw DIAGRAM and lets you efficiently collaborate even with people who maybe don't have this software.HelpDesk
How to Make SWOT Analysis in a Word Document
A SWOT analysis is a strategic planning tool that helps to identify and compare strengths and weaknesses with opportunities and threats to make a decision and create an action plan. When performing a SWOT analysis, one can create a table split up into four columns so as to list each impacting element side-by-side for comparison, but typically it is conducted using a four-square SWOT analysis template. Using mind map allows you to collect and structure a piece of information involved in SWOT Analysis then, you can export your SWOT mind map into an MS Word document that allows you to present and collaborate your business strategic SWOT analysis matrix in MS Word document.HelpDesk
How to Add a Fishbone (Ishikawa) Diagram to an MS Word Document
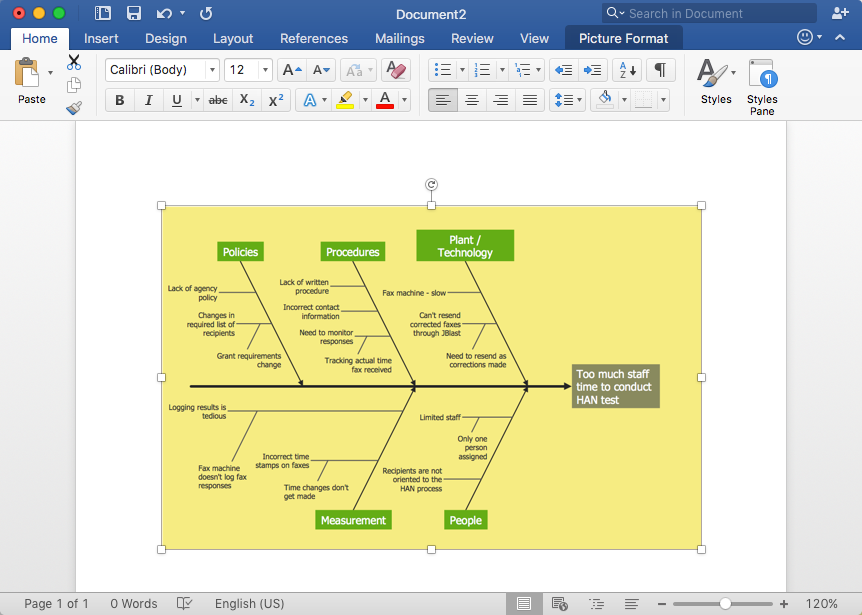
The ability to create a fishbone (Ishikawa) Diagram is supported by the ConceptDraw Fishbone Diagram solution. ConceptDraw DIAGRAM allows you to easily create a fishbone diagrams and then insert them into a MS Word document.
 Fishbone Diagram
Fishbone Diagrams solution extends ConceptDraw DIAGRAM software with templates, samples and library of vector stencils for drawing the Ishikawa diagrams for cause and effect analysis.
How To Create Onion Diagram
An onion diagram is a kind of chart that shows the dependencies among parts of an organization or process. The chart displays items in concentric circles, where the items in each ring depend on the items in the smaller rings. The Onion Diagram is able to show layers of a complete system in a few circles. But how to create Onion Diagram? Now, it's very easy thanks to the ConceptDraw DIAGRAM diagramming and vector drawing software extended with Stakeholder Onion Diagrams Solution from the Management Area of ConceptDraw Solution Park.
 Entity-Relationship Diagram (ERD)
Entity-Relationship Diagram (ERD) solution extends ConceptDraw DIAGRAM software with templates, samples and libraries of vector stencils from drawing the ER-diagrams by Chen's and crow’s foot notations.
 Cafe and Restaurant Floor Plans
Restaurants and cafes are popular places for recreation, relaxation, and are the scene for many impressions and memories, so their construction and design requires special attention. Restaurants must to be projected and constructed to be comfortable and e
- How to Make SWOT Analysis in a Word Document | SWOT Template ...
- Swot Analysis Template Word Doc
- SWOT Analysis | SWOT Matrix Template | SWOT analysis matrix ...
- Swot Analysis Template Editable Doc
- How to Make SWOT Analysis in a Word Document | SWOT Matrix ...
- How to Make SWOT Analysis in a Word Document | Swot Analysis ...
- How to Make SWOT Analysis in a Word Document | How to Create a ...
- How to Create SWOT Analysis Template in ConceptDraw PRO ...
- How to Create SWOT Analysis Template in ConceptDraw PRO ...
- How to Make SWOT Analysis in a Word Document | SWOT analysis ...
- How to Convert a Mind Map into MS Word Document | How to Use ...
- How to Make SWOT Analysis in a Word Document | Ansoff Matrix ...
- How to Make SWOT Analysis in a Word Document | Block diagram ...
- How to Make SWOT Analysis in a Word Document
- Value Chain Analysis Template
- SWOT Analysis | SWOT Matrix Template | How to Make SWOT ...
- SWOT Analysis | How to Create SWOT Analysis Template in ...
- SWOT analysis Software & Template for Macintosh and Windows ...
- SWOT Analysis | SWOT analysis for a small independent bookstore ...


