 Logistics Flow Charts
Logistics Flow Charts solution extends ConceptDraw PRO v11 functionality with opportunities of powerful logistics management software. It provides large collection of predesigned vector logistic symbols, pictograms, objects and clipart to help you design with pleasure Logistics flow chart, Logistics process flow diagram, Inventory flow chart, Warehouse flowchart, Warehouse management flow chart, Inventory control flowchart, or any other Logistics diagram. Use this solution for logistics planning, to reflect logistics activities and processes of an enterprise or firm, to depict the company's supply chains, to demonstrate the ways of enhancing the economic stability on the market, to realize logistics reforms and effective products' promotion.
HelpDesk
How to Make a Logistics Flow Chart

 Logistic Dashboard
The powerful tools of Logistic Dashboard solution and specially developed live graphic objects of logistic icons, logistic navigation elements, logistic indicators, logistic charts and logistic maps effectively assist in designing Logistic dashboards, Logistic maps, Logistic charts, diagrams and infographics. The included set of prebuilt samples and quick-start templates, demonstrates the power of ConceptDraw PRO software in logistics management, its assisting abilities in development, realization and analyzing the logistic processes, as well as in perfection the methods of logistics management.
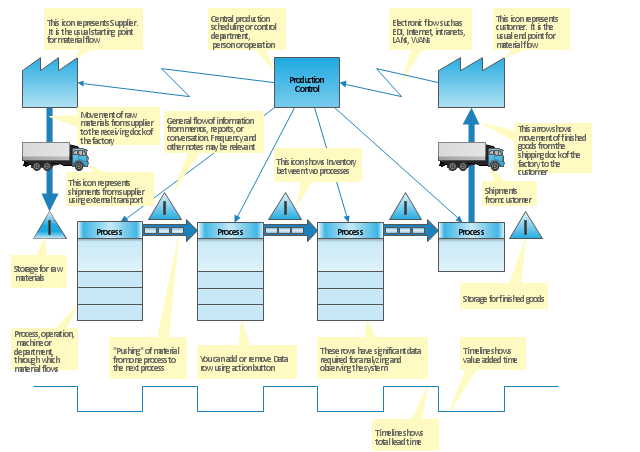
"Value stream mapping is a lean management principle used to analyze and design the flow of materials and information required to bring a product or service to a consumer. Pioneered by Henry Ford in the 1920s, perfected by Toyota. At Toyota, it is known as "material and information flow mapping". It can be applied to nearly any value chain. ...
Value stream mapping has supporting methods that are often used in Lean environments to analyze and design flows at the system level (across multiple processes).
Although value stream mapping is often associated with manufacturing, it is also used in logistics, supply chain, service related industries, healthcare, software development, product development, and administrative and office processes." [Value stream mapping. Wikipedia]
This value stream map template explains the meanings of the VSM design elements.
This Value stream map template for the ConceptDraw PRO diagramming and vector drawing software is included in the Value Stream Mapping solution from the Quality area of ConceptDraw Solution Park.
VSM template
HelpDesk
How to Make a Logistic Dashboard

Process Flowchart


 Plumbing and Piping Plans
Plumbing and Piping Plans solution extends ConceptDraw PRO v10.2.2 software with samples, templates and libraries of pipes, plumbing, and valves design elements for developing of water and plumbing systems, and for drawing Plumbing plan, Piping plan, PVC Pipe plan, PVC Pipe furniture plan, Plumbing layout plan, Plumbing floor plan, Half pipe plans, Pipe bender plans.
Flow chart Example. Warehouse Flowchart


 Electrical Engineering
This solution extends ConceptDraw PRO v.9.5 (or later) with electrical engineering samples, electrical schematic symbols, electrical diagram symbols, templates and libraries of design elements, to help you design electrical schematics, digital and analog
 Business Process Mapping
The Business Process Mapping solution for ConceptDraw PRO is for users involved in process mapping and creating SIPOC diagrams.
 Area Charts
Area Charts are used to display the cumulative totals over time using numbers or percentages; or to show trends over time among related attributes. The Area Chart is effective when comparing two or more quantities. Each series of data is typically represented with a different color, the use of color transparency in an object’s transparency shows overlapped areas and smaller areas hidden behind larger areas.
 Office Layout Plans
Office layouts and office plans are a special category of building plans and are often an obligatory requirement for precise and correct construction, design and exploitation office premises and business buildings. Designers and architects strive to make office plans and office floor plans simple and accurate, but at the same time unique, elegant, creative, and even extraordinary to easily increase the effectiveness of the work while attracting a large number of clients.
- Process Flowchart | Logistics Flow Charts | Types of Flowcharts ...
- Process Flowchart | Logistics Flow Charts | Cross-Functional ...
- Process Flowchart | Logistics Flow Charts | Competitor Analysis ...
- Logistics Flow Charts | Presentation Exchange | Think. Act ...
- Process Flowchart | Total Quality Management Definition | Logistics ...
- Total Quality Management Definition | Process Flowchart | Logistics ...
- Logistics Flow Charts | How To use House Electrical Plan Software ...
- CS Odessa Announces Logistics Flow Charts Addition to ...
- New Logistic Dashboard Addition to ConceptDraw Solution Park
- Logistics Flow Charts | Activity Network Diagram Method | Basic ...
- CS Odessa Announces Logistics Flow Charts Addition to ...
- Visio Supply Chain Examples
- Logistics Flow Charts | Process Flowchart | How to Make a Logistics ...
- Process Flowchart | Logistics Flow Charts | How to Make a Logistics ...
- Process Flowchart | Logistics Flow Charts | Business Process ...
- Process Flowchart | Logistics Flow Charts | Flow chart Example ...
- Logistics Workflow
- Logistics - Choreography BPMN 2.0 diagram | Logistics Flow Charts ...
- Bubble diagrams with ConceptDraw PRO | Pyramid Diagram ...
- Business Process Mapping Methods In Supply Chain Management