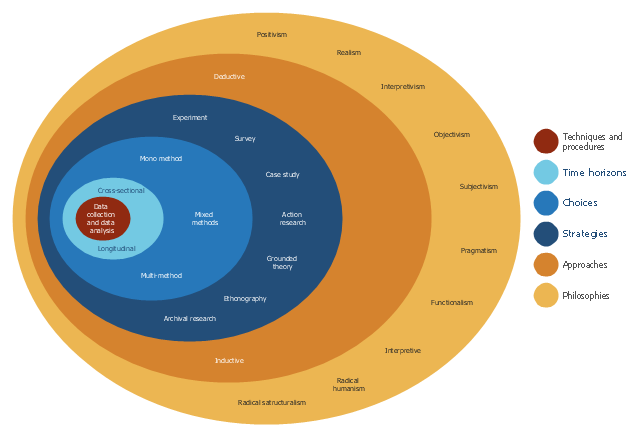
This onion diagram example was designed on the base of figure "Research onion" in the article "The research methodology for the development of a kaizen costing framework suitable for indigenous construction firms in Lagos, Nigeria." by T. Omotayo and U. Kulatunga from the Association of Researchers in Construction Management (ARCOM) website.
"The need for a cost management paradigm shift in the construction industry is imperative because of the prevailing challenges of managing construction cost during construction. Small and medium scale construction firms in Nigeria are faced with the challenges of competition from foreign firm, cost overrun, project delays and unsatisfied clients. This challenge may be handled with kaizen principles and kaizen costing. This paper utilized literatures related to research methodology in the built environment to create a research framework for the study. This focused on the research philosophical stands, approaches and strategy related to the built environment. The research onion model was adopted for the framework development and the sample size of two hundred and fifty (250) respondents was selected based on theoretical sampling for quantitative data collection using questionnaires." [arcom.ac.uk/ -docs/ workshops/ 2015-04_ Dublin-Proceedings.pdf]
The onion diagram example "Research onion diagram" was drawn using the ConceptDraw PRO software extended with the Stakeholder Onion Diagrams solution from the Management area of ConceptDraw Solution Park.
Onion diagram example
 Stakeholder Onion Diagrams
The Stakeholder Onion Diagram is often used as a way to view the relationships of stakeholders to a project goal. A basic Onion Diagram contains a rich information. It shows significance of stakeholders that will have has influence to the success achieve
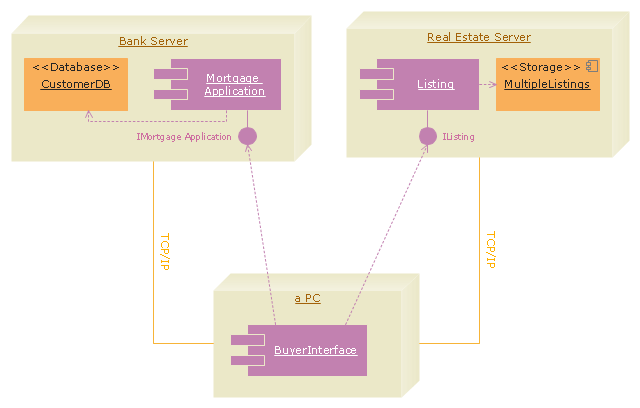
"A real estate transaction is the process whereby rights in a unit of property (or designated real estate) is transferred between two or more parties, e.g. in case of conveyance one party being the seller(s) and the other being the buyer(s). It can often be quite complicated due to the complexity of the property rights being transferred, the amount of money being exchanged, and government regulations. Conventions and requirements also vary considerably among different countries of the world and among smaller legal entities (jurisdictions).
In more abstract terms, a real estate transaction, like other financial transactions, causes transaction costs. To identify and possibly reduce these transaction costs, the Organization for Economic Co-operation and Development (OECD) addressed the issue through a study commissioned by the European Commission, and through a research action.
The mentioned research action ‘Modelling Real Property Transactions’ investigated methods to describe selected transactions in a formal way, to allow for comparisons across countries / jurisdictions. Descriptions were performed both using a more simple format, a Basic Use Case template, and more advanced applications of the Unified Modelling Language. Process models were compared through an ontology-based methodology, and national property transaction costs were estimated for Finland and Denmark, based on the directions of the United Nations System of National Accounts." [Real estate transaction. Wikipedia]
The UML deployment diagram example "Real estate transactions" was created using the ConceptDraw PRO diagramming and vector drawing software extended with the Rapid UML solution from the Software Development area of ConceptDraw Solution Park.
UML deployment diagram
 Fishbone Diagrams
The Fishbone Diagrams solution extends ConceptDraw PRO v10 software with the ability to easily draw the Fishbone Diagrams (Ishikawa Diagrams) to clearly see the cause and effect analysis and also problem solving. The vector graphic diagrams produced using this solution can be used in whitepapers, presentations, datasheets, posters, and published technical material.
 Workflow Diagrams
Workflow Diagrams solution extends ConceptDraw PRO software with samples, templates and vector stencils library for drawing the work process flowcharts.
Applications

- Research onion diagram
- Research onion diagram | Stakeholder Onion Diagrams | How To ...
- Research onion diagram | How To Create Onion Diagram ...
- Research onion diagram | Process Flowchart | Best Program to ...
- Research onion diagram | Stakeholder diagram | Active Living for All ...
- Research onion diagram | Competitor Analysis | Research Onion Of ...
- Research cycle - Circle diagram | Research onion diagram ...
- Process Flowchart | Research onion diagram | Entity-Relationship ...
- Pipette Diagram
- Mechanical Drawing Symbols | Electrical Diagram | Pyramid ...
- UML Deployment Diagram Example
- Electrical Diagram Software | Electrical Engineering | Electrical ...
- Home Electrical Plan | Electrical Diagram | Electrical Engineering ...
- PDCA cycle | Research cycle - Circle diagram | Life cycle of an ...
- Research cycle - Circle diagram | Export from ConceptDraw PRO ...
- Flowchart Marketing Process. Flowchart Examples | Flowchart ...
- How To Create Onion Diagram | Onion Diagram Process Design ...
- Fishbone Diagrams | Fishbone Diagram | Process Flowchart ...
- Innovation life cycle - Arrow loop diagram | Circular Arrows ...
- Circular arrows diagram - BPM life cycle