UML Use Case Diagram Example. Social Networking Sites Project

Example of DFD for Online Store (Data Flow Diagram)


 Entity-Relationship Diagram (ERD)
Entity-Relationship Diagram (ERD) solution extends ConceptDraw DIAGRAM software with templates, samples and libraries of vector stencils from drawing the ER-diagrams by Chen's and crow’s foot notations.
Data Flow Diagram Software

Data structure diagram with ConceptDraw DIAGRAM

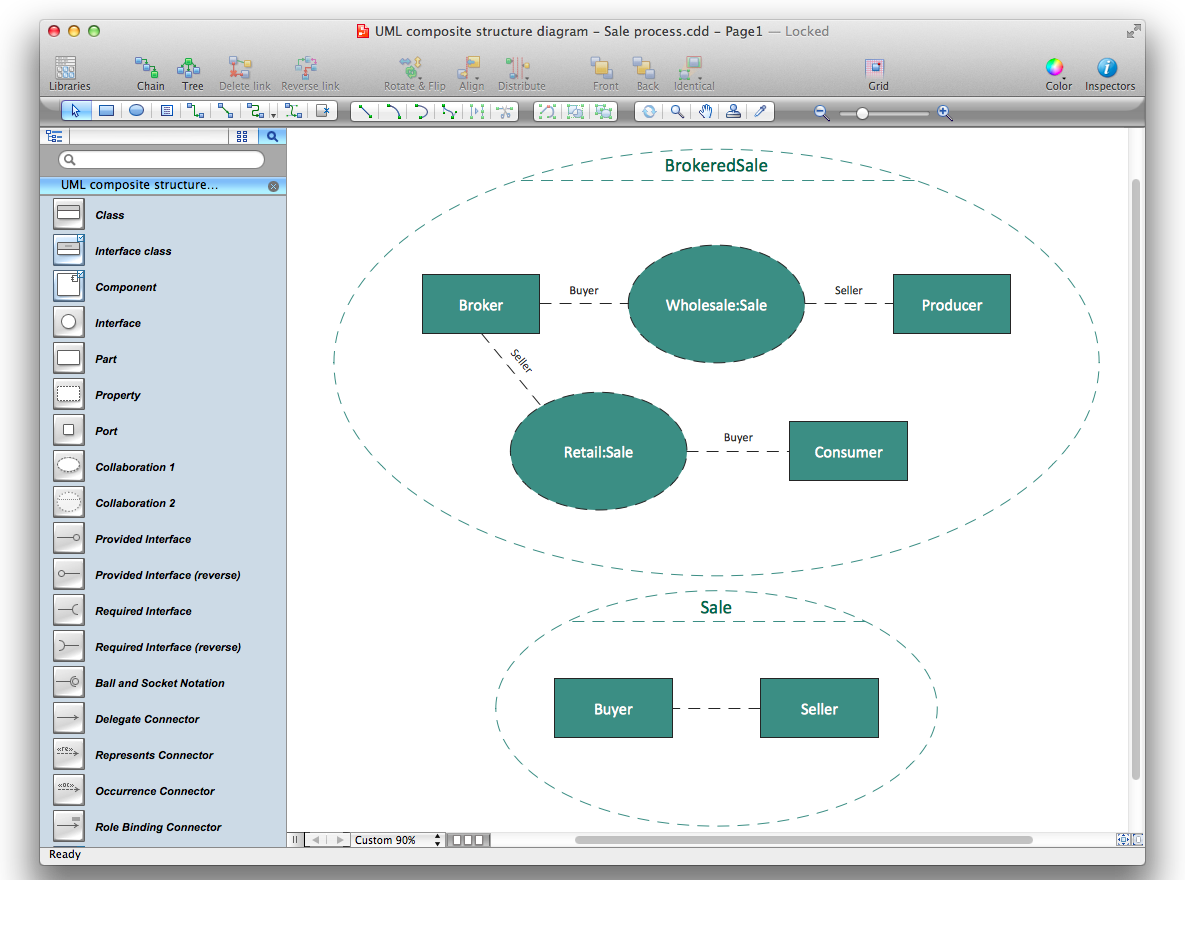
Diagramming Software for UML Composite Structure Diagrams

 Event-driven Process Chain Diagrams
Event-Driven Process Chain Diagrams solution extends ConceptDraw DIAGRAM functionality with event driven process chain templates, samples of EPC engineering and modeling the business processes, and a vector shape library for drawing the EPC diagrams and EPC flowcharts of any complexity. It is one of EPC IT solutions that assist the marketing experts, business specialists, engineers, educators and researchers in resources planning and improving the business processes using the EPC flowchart or EPC diagram. Use the EPC solutions tools to construct the chain of events and functions, to illustrate the structure of a business process control flow, to describe people and tasks for execution the business processes, to identify the inefficient businesses processes and measures required to make them efficient.
 Fishbone Diagrams
The Fishbone Diagrams solution extends ConceptDraw DIAGRAM software with the ability to easily draw the Fishbone Diagrams (Ishikawa Diagrams) to clearly see the cause and effect analysis and also problem solving. The vector graphic diagrams produced using this solution can be used in whitepapers, presentations, datasheets, posters, and published technical material.
 Plumbing and Piping Plans
Plumbing and Piping Plans solution extends ConceptDraw DIAGRAM.2.2 software with samples, templates and libraries of pipes, plumbing, and valves design elements for developing of water and plumbing systems, and for drawing Plumbing plan, Piping plan, PVC Pipe plan, PVC Pipe furniture plan, Plumbing layout plan, Plumbing floor plan, Half pipe plans, Pipe bender plans.
 Office Layout Plans
Office layouts and office plans are a special category of building plans and are often an obligatory requirement for precise and correct construction, design and exploitation office premises and business buildings. Designers and architects strive to make office plans and office floor plans simple and accurate, but at the same time unique, elegant, creative, and even extraordinary to easily increase the effectiveness of the work while attracting a large number of clients.
 Accounting Flowcharts
Accounting Flowcharts solution extends ConceptDraw DIAGRAM software with templates, samples and library of vector stencils for drawing the accounting flow charts.
- Er Diagram And Dfd Diagram Of Atm Machine System
- Data Flow Diagrams ( DFD ) | ConceptDraw PRO ER Diagram Tool ...
- Data Flow Diagrams ( DFD ) | Process Flowchart | Entity-Relationship ...
- Data Flow Diagrams ( DFD ) | Process Flowchart | Banking System ...
- Data Flow Diagram Of Banking Database Management System
- Data Flow Diagrams ( DFD ) | ConceptDraw PRO ER Diagram Tool ...
- Entity-Relationship Diagram ( ERD ) | Data Flow Diagrams ( DFD ...
- Data Flow Diagram Software | ERD Symbols and Meanings ...
- Data Flow Diagram Of Banking System Pdf
- ConceptDraw PRO ER Diagram Tool | Data Flow Diagrams ( DFD ...
- Data Flow Diagram Online Banking System Pdf
- Data Flow Diagrams | Components of ER Diagram | ConceptDraw ...
- Data Flow Diagrams ( DFD ) | ATM UML Diagrams | ConceptDraw ...
- Banking System Analysis Er Diagram
- Entity-Relationship Diagram ( ERD ) | Data Flow Diagrams | Entity ...
- Dfd And Er Diagram For Atm Project
- Data Flow Diagrams ( DFD ) | Example of DFD for Online Store ( Data ...
- DFD - Process of account receivable | Data Flow Diagram Process ...
- Data Flow Diagrams ( DFD ) | Example of DFD for Online Store ( Data ...
- Er Diagram Dfd For Atm