The cycle diagram sample was created on the base of the figure illustrating the webpage "2. POLICY & STRATEGY" of "Scottish Police College Primary Inspection 2006: A Report by Her Majesty's Inspectorate of Constabulary" from the Scottish Government website.
"Strategic Planning.
2.1 The planning process for the College currently follows a structured approach, starting in April and extending through the financial year. The planning cycle is illustrated in figure 2. ...
2.2 The College recognises the need to consult with its customers and stakeholders in the process of setting objectives and directing the training programme. The planning cycle to date refers to force visits, environmental scanning, the course planning process which involves consultation with all forces and other common police services, as well as to a survey of external providers.
2.3 The information from consultation feeds into an EFQM framework from which the College has identified four key policies, namely:
(1) developing and delivering quality training;
(2) developing our people through lifelong learning;
(3) continuous improvement of our service; and
(4) embracing the changing environment.
2.4 The objectives set at divisional level are designed to contribute to delivering these policies. HMIC found that whilst the selected objectives were presented in line with the structure, not all could be considered to meet SMART (Specific, Measurable, Achievable, Relevant and Timed) criteria. This failure indicates that while the process appears suitably structured to deliver a robust result, some of those involved could perhaps have a better understanding of the process." [scotland.gov.uk/ Publications/ 2007/ 02/ 15134652/ 8]
The cycle diagram example "Strategic planning" was created using the ConceptDraw PRO diagramming and vector drawing software extended with the Target and Circular Diagrams solution from the Marketing area of ConceptDraw Solution Park.
www.conceptdraw.com/ solution-park/ marketing-target-and-circular-diagrams
Cycle diagram

This arrow loop diagram sample was created on the base of the figure illustrating the webpage "Safe Roads for a Safer Future A Joint Safety Strategic Plan" from the website of US Department of Transportation - Federal Highway Administration (FHWA) Office of Safety.
"STRATEGIC PLANNING CYCLE.
After the safety units issue the SSP, they will identify and prioritize strategies to support the established goals. Many strategies will originate in existing roadmaps or in other program planning activities. The safety units will also use this information when developing their Unit Performance Plans and individual performance plans. Teams within each safety unit will carry out projects and activities to support identified strategies and achieve the SSP goals.
The SSP process also includes continuous performance monitoring and evaluation through which the safety units will review past accomplishments against the established goals, consider how well strategies are implemented, assess progress toward goals, identify risks, consider changes in the environment, and discuss future strategic direction. As a part of the evaluation process, the three safety units will recognize achievements and discuss the need for adjustments. Figure ... shows the strategic planning cycle.
The safety units will update the SSP every 3 to 5 years using input from a variety of sources, including evaluations, safety trends, and legislative changes." [safety.fhwa.dot.gov/ ssp/ ]
The arrow loop diagram example "Strategic planning cycle" was created using the ConceptDraw PRO diagramming and vector drawing software extended with the Target and Circular Diagrams solution from the Marketing area of ConceptDraw Solution Park.
www.conceptdraw.com/ solution-park/ marketing-target-and-circular-diagrams
Arrow loop diagram
 Target and Circular Diagrams
This solution extends ConceptDraw PRO software with samples, templates and library of design elements for drawing the Target and Circular Diagrams.
BPR Diagram. Business Process Reengineering Example

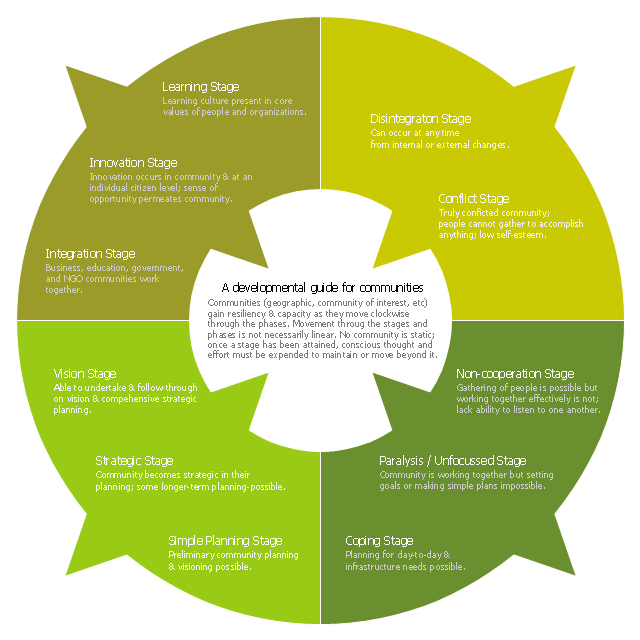
This ring chart sample was created on the base of the figure illustrating the "CCP Handbook - Comprehensive Community Planning for First Nations in British Columbia" from the Government of Canada website. "Tool 1: Centre for Innovative & Entrepreneurial Leadership (CIEL) Community Life Cycle Matrix.
Actualization Phase.
Community is highly developed and encourages learning & innovation while respecting history and culture. Community shares resources with others and regularly monitors itself, continuing to enhance capacity.
Action: Community undertakes regular reviews and reflection activities to maintain or enhance stage / phase.
Pre-Community or Chaos Phase.
Community is undeveloped. Limited sharing of resources or recognition of value of a community.
Action: Community can (re)form through the identification of and action of influential and respected leaders (elected or unelected).
Vision Phase.
Community recognizes the importance of vision and long-term planning; is able to move in this direction.
Action: Community can engage in planning, meaningful consultation of its members, & working towards the development of strategic thinking & planning, and, ultimately, identifying community-wide values, distinct community characteristics and a vision.
Emergence Phase.
Community exists but has significant problems, making anything but survival & fulfilling short-term needs impossible.
Action: Community can advance through focus on small, non-political, trustbuilding projects to build success, respect, confidence, relationships & skills.
Why the Matrix.
The challenge of developing innovative and entrepreneurial communities is in ensuring that the communities have a clear picture of where they are at and where they want to go. This enables a better match of the tools available with both the capacity of the community and the hoped for goal. For example, while strategic planning may work for some communities, the planning process may also lead to frustration and failure in other communities that do not have the necessary trust, social capital or capacity." [aadnc-aandc.gc.ca/ eng/ 1100100021972/ 1100100022090]
The ring chart example "Community life cycle matrix" was created using the ConceptDraw PRO diagramming and vector drawing software extended with the Target and Circular Diagrams solution from the Marketing area of ConceptDraw Solution Park.
www.conceptdraw.com/ solution-park/ marketing-target-and-circular-diagrams
Ring chart
This arrow ring chart sample was created on the base of the figure illustrating the webpage "National Preparedness Cycle. Plan" from the Federal Emergency Management Agency (FEMA) website. "Planning makes it possible to manage the entire life cycle of a potential crisis. Strategic and operational planning establishes priorities, identifies expected levels of performance and capability requirements, provides the standard for assessing capabilities and helps stakeholders learn their roles. The planning elements identify what an organization’s Standard Operating Procedures (SOPs) or Emergency Operations Plans (EOPs) should include for ensuring that contingencies are in place for delivering the capability during a large-scale disaster." [fema.gov/ plan]
The arrow ring chart example "National Preparedness Cycle" was created using the ConceptDraw PRO diagramming and vector drawing software extended with the Target and Circular Diagrams solution from the Marketing area of ConceptDraw Solution Park.
www.conceptdraw.com/ solution-park/ marketing-target-and-circular-diagrams
Arrow ring chart
This arrow circle diagram sample was redesigned from the Wikimedia Commons file: Loyalitätskreislauf-klein.jpg. [commons.wikimedia.org/ wiki/ File:Loyalit%C3%A4tskreislauf-klein.jpg]
This file is licensed under the Creative Commons Attribution-Share Alike 3.0 Unported license. [creativecommons.org/ licenses/ by-sa/ 3.0/ deed.en]
"Loyalty marketing is an approach to marketing, based on strategic management, in which a company focuses on growing and retaining existing customers through incentives. Branding, product marketing and loyalty marketing all form part of the customer proposition - the subjective assessment by the customer of whether to purchase a brand or not based on the integrated combination of the value they receive from each of these marketing disciplines.
The discipline of customer loyalty marketing has been around for many years...
In recent years, a new marketing discipline called "customer advocacy marketing" has been combined with or replaced "customer loyalty marketing." " [Loyalty marketing. Wikipedia]
The arrow circle diagram example "Loyalty" was created using the ConceptDraw PRO diagramming and vector drawing software extended with the Target and Circular Diagrams solution from the Marketing area of ConceptDraw Solution Park.
www.conceptdraw.com/ solution-park/ marketing-target-and-circular-diagrams
Arrow circle diagram
Ansoff Matrix

This circular arrows diagram sample shows business process management life cycle.
It was designed on the base of the Wikimedia Commons file: Business Process Management Life-Cycle.svg. [commons.wikimedia.org/ wiki/ File:Business_ Process_ Management_ Life-Cycle.svg]
This file is licensed under the Creative Commons Attribution-Share Alike 3.0 Unported license. [creativecommons.org/ licenses/ by-sa/ 3.0/ deed.en]
"BPM life-cycle.
Business process management activities can be grouped into six categories: vision, design, modeling, execution, monitoring, and optimization.
Functions are designed around the strategic vision and goals of an organization. Each function is attached with a list of processes. Each functional head in an organization is responsible for certain sets of processes made up of tasks which are to be executed and reported as planned. Multiple processes are aggregated to function accomplishments and multiple functions are aggregated to achieve organizational goals." [Business process management. Wikipedia]
The arrow donut chart example "BPM life cycle" was created using the ConceptDraw PRO diagramming and vector drawing software extended with the Circular Arrows Diagrams solution from the area "What is a Diagram" of ConceptDraw Solution Park.
Circular arrows diagram

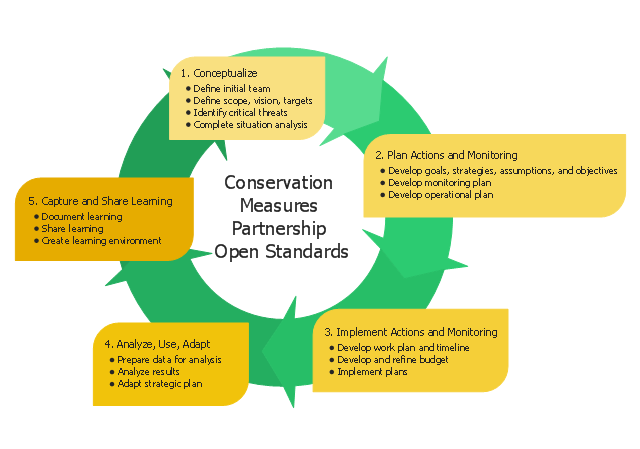
This circular arrows diagram sample shows five steps of the Conservation Measures Partnership (CMP) adaptive management cycle. It was designed on the base of the Wikimedia Commons file: CMP Cycle - 2008-02-20.jpg.
[commons.wikimedia.org/ wiki/ File:CMP_ Cycle_ -_ 2008-02-20.jpg]
"Adaptive management (AM), also known as adaptive resource management (ARM), is a structured, iterative process of robust decision making in the face of uncertainty, with an aim to reducing uncertainty over time via system monitoring. In this way, decision making simultaneously meets one or more resource management objectives and, either passively or actively, accrues information needed to improve future management. Adaptive management is a tool which should be used not only to change a system, but also to learn about the system. Because adaptive management is based on a learning process, it improves long-run management outcomes. The challenge in using the adaptive management approach lies in finding the correct balance between gaining knowledge to improve management in the future and achieving the best short-term outcome based on current knowledge.
Application to environmental projects and programs.
Open Standards for the Practice of Conservation lay out 5 main steps to an adaptive management project cycle." [Adaptive management. Wikipedia]
The diagram example "CMP adaptive management cycle" was created using the ConceptDraw PRO diagramming and vector drawing software extended with the Circular Arrows Diagrams solution from the area "What is a Diagram" of ConceptDraw Solution Park.
Circular arrows diagram
Used Solutions
Competitor Analysis

 Circle-Spoke Diagrams
Examples of subject areas that are well suited to this approach are marketing, business, products promotion, process modeling, market, resource, time, and cost analysis. Circle-Spoke Diagrams are successfully used in presentations, conferences, management documents, magazines, reportages, reviews, reports, TV, and social media.
 Basic Circle-Spoke Diagrams
Basic circle-spoke diagrams are well suited for marketing, management documents, and presentations.
This circle pie chart sample was created on the base of the figure illustrating the article "Impacts of Parking Strategies" from the Chicago Metropolitan Agency for Planning website. "Todd Litman's "Cycle of Automobile Dependency" shows how auto-centric land use planning and excessive parking supply have created this situation. Parking management strategies can be used to break this cycle, by changing development patterns and improving travel options (2006)." [cmap.illinois.gov/ about/ 2040/ supporting-materials/ process-archive/ strategy-papers/ parking/ impacts-of-parking-strategies]
The circle pie chart example "Cycle of automobile dependency" was created using the ConceptDraw PRO diagramming and vector drawing software extended with the Target and Circular Diagrams solution from the Marketing area of ConceptDraw Solution Park.
www.conceptdraw.com/ solution-park/ marketing-target-and-circular-diagrams
Circle pie chart

Venn Diagram

- Successful Strategic Plan | Strategic planning - Cycle diagram ...
- Strategic planning - Cycle diagram | Successful Strategic Plan ...
- Strategic planning - Cycle diagram
- Strategic Planning Cycle Diagram And Explanation
- Strategic planning cycle - Arrow loop diagram | SWOT Analysis ...
- Strategic planning cycle - Arrow loop diagram | Basic Flowchart ...
- Strategic planning - Cycle diagram | Steps of Accounting Cycle ...
- Innovation life cycle - Arrow loop diagram | Strategic planning cycle ...
- Strategic planning cycle - Arrow loop diagram | National ...
- Strategic planning cycle - Arrow loop diagram | Basic Flowchart ...
- Strategic planning - Cycle diagram | Water cycle diagram ...
- Program assessment plan - Arrow circle diagram | Strategic ...
- Strategic planning - Cycle diagram | Organizational Structure ...
- Sample Strategic Planning Or Cycle
- Strategic planning - Cycle diagram | Process Flowchart | Sales ...
- Process Flowchart | Organizational Structure Total Quality ...
- Strategic planning - Cycle diagram | Process Flowchart | Strategic ...
- Strategic planning - Cycle diagram | BPR Diagram. Business ...
- Process Flowchart | Strategic planning - Cycle diagram | Agile ...
- Strategic planning - Cycle diagram | ConceptDraw Solution Park ...