IDEF3 Standard

 Mathematics
Mathematics solution extends ConceptDraw PRO software with templates, samples and libraries of vector stencils for drawing the mathematical illustrations, diagrams and charts.
Process Flow Chart

Bar Diagrams for Problem Solving. Create space science bar charts with Bar Graphs Solution

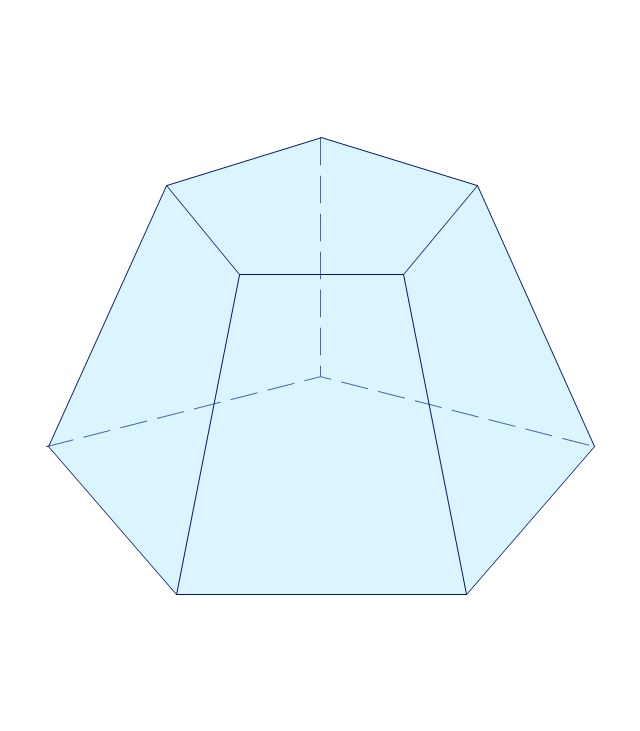
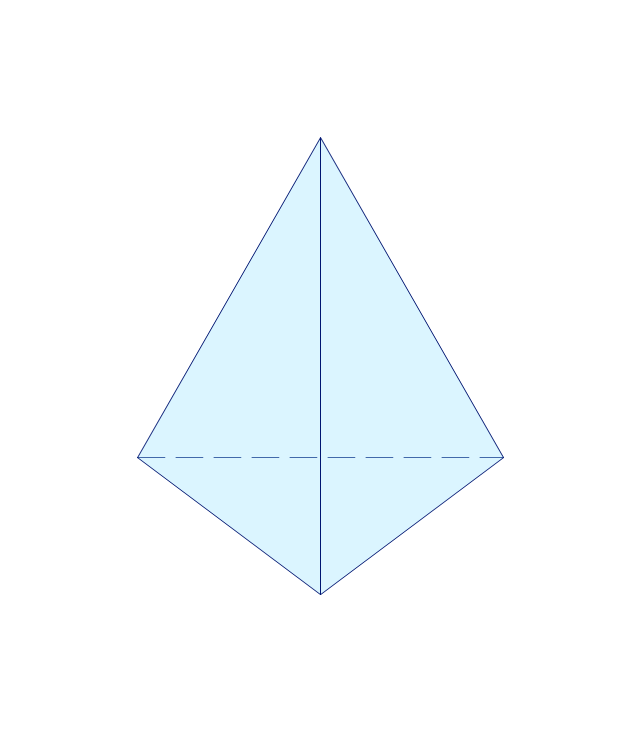
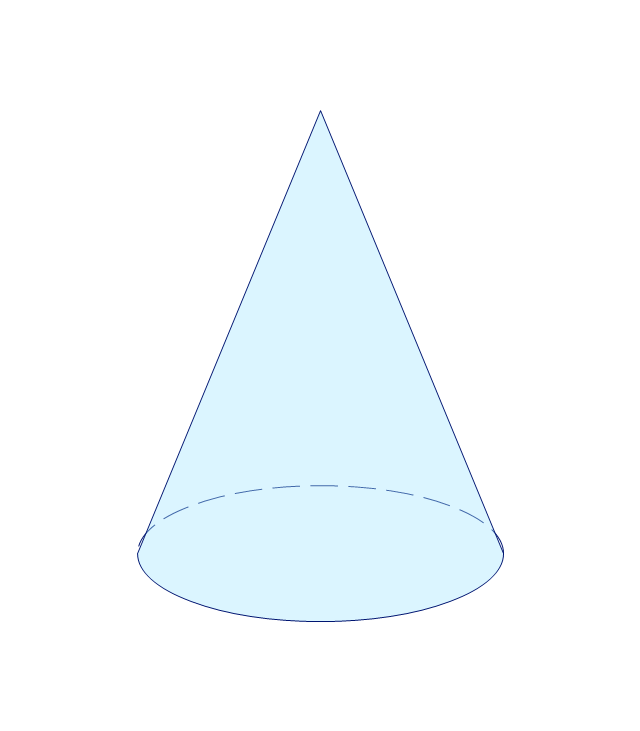
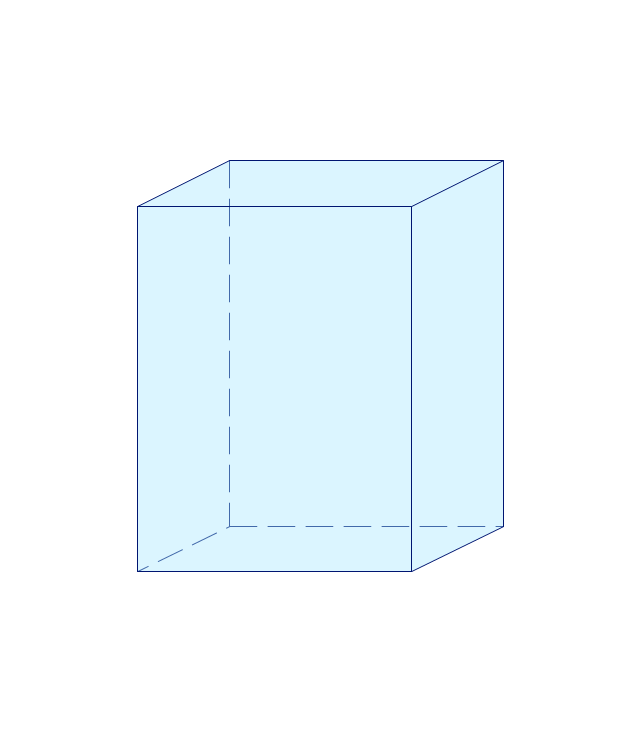
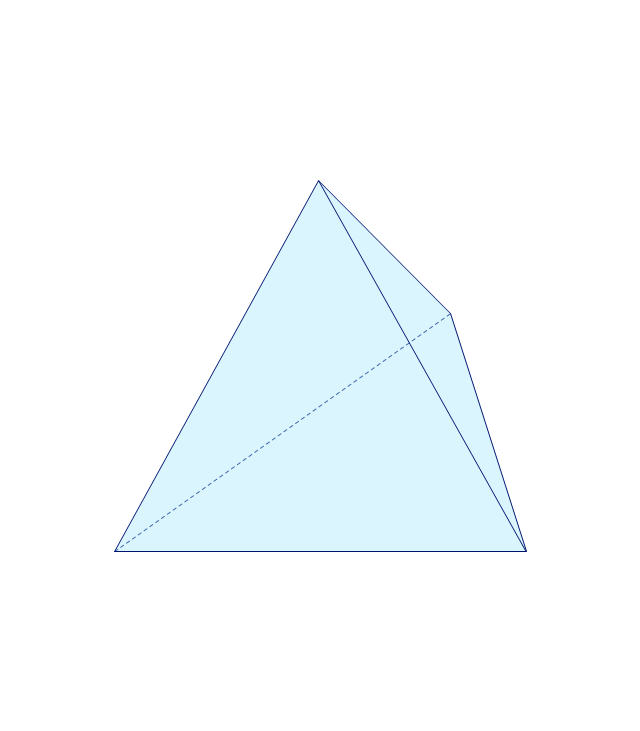
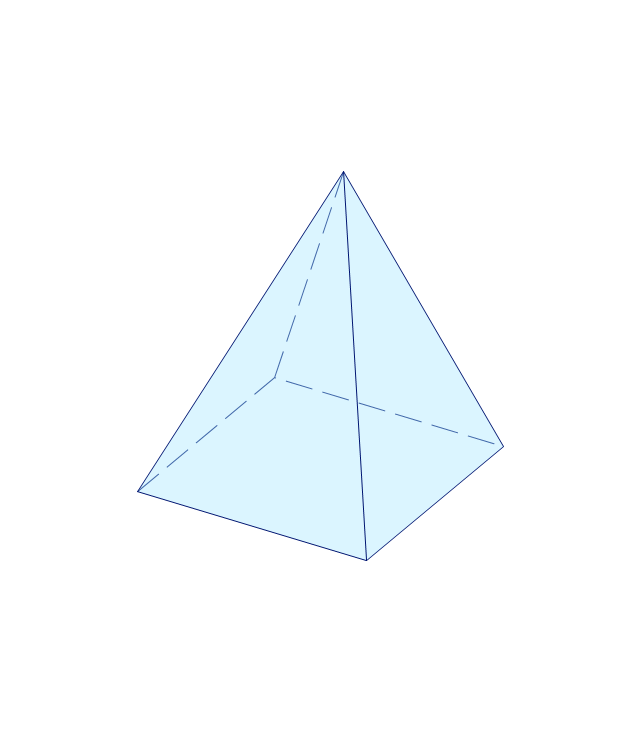
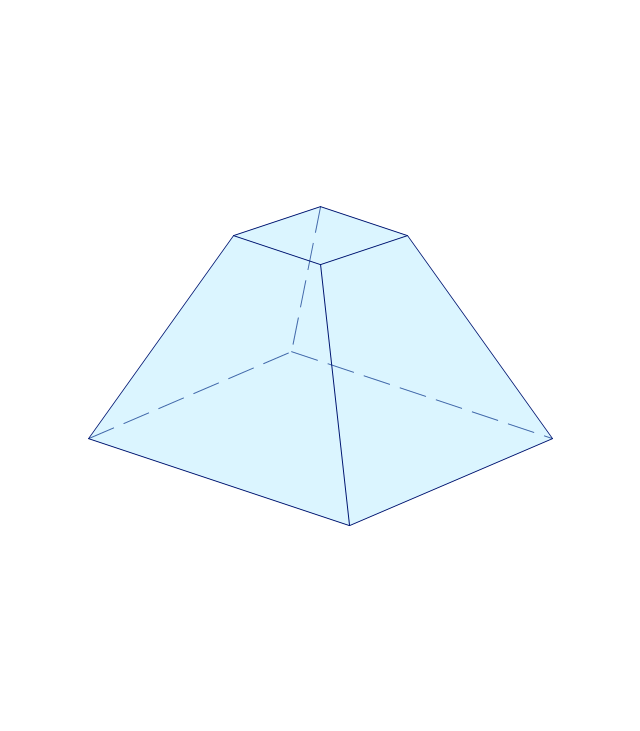
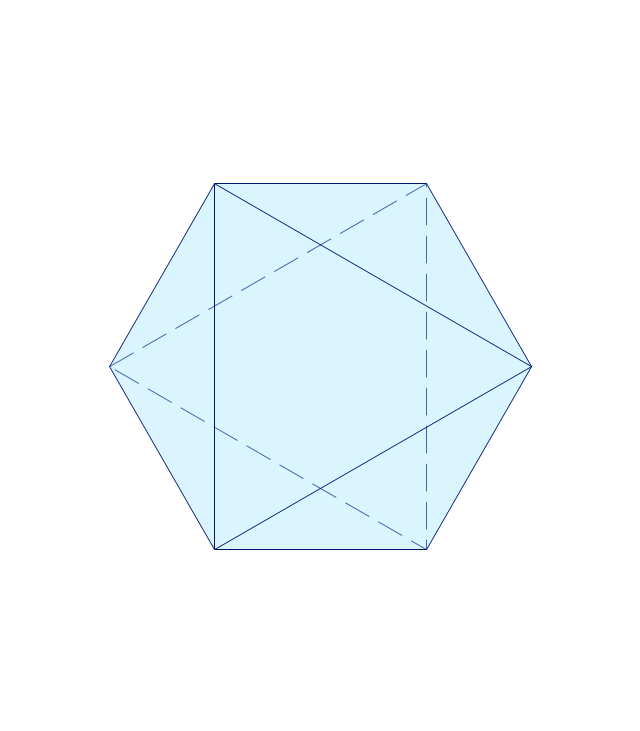
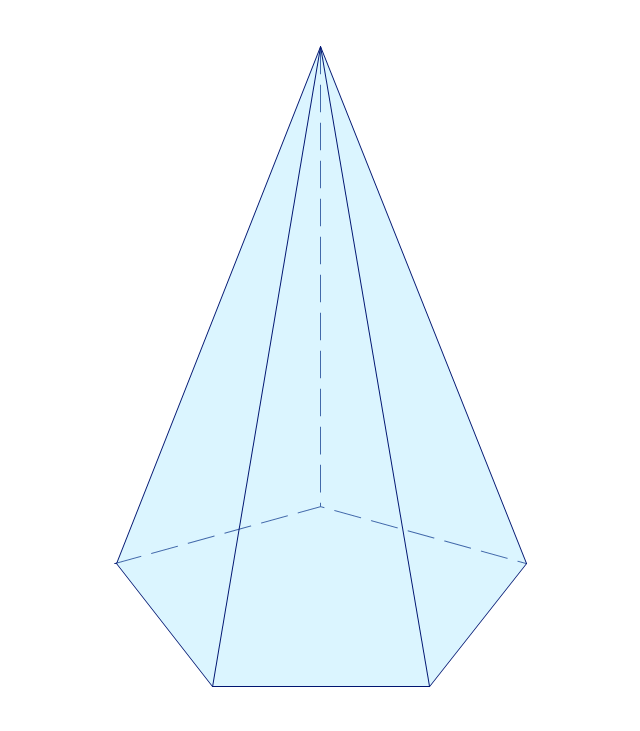
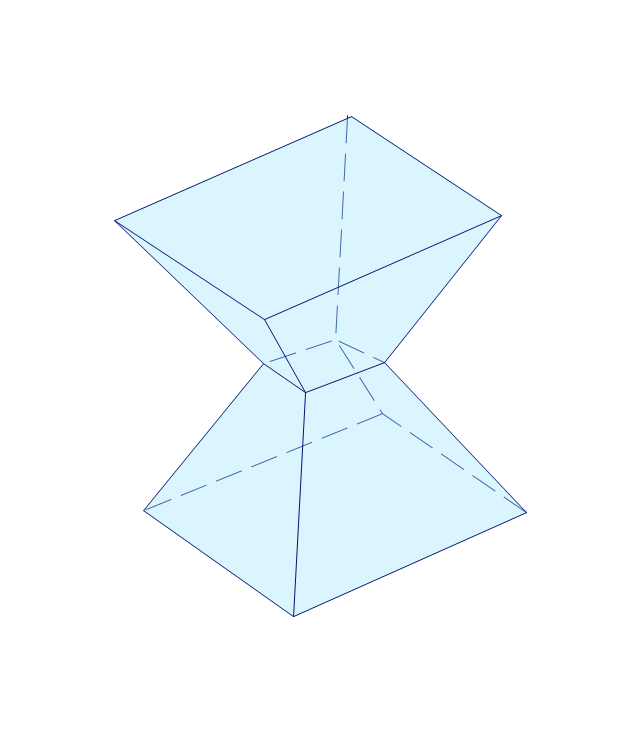
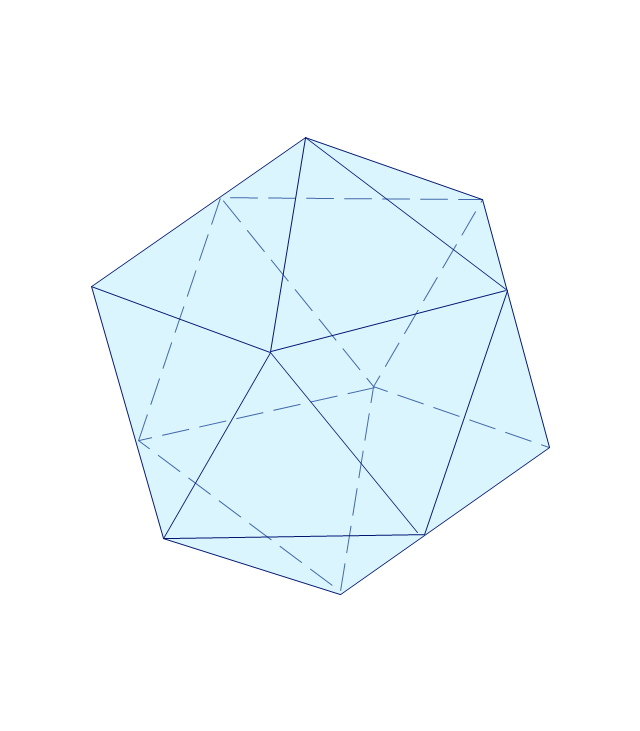
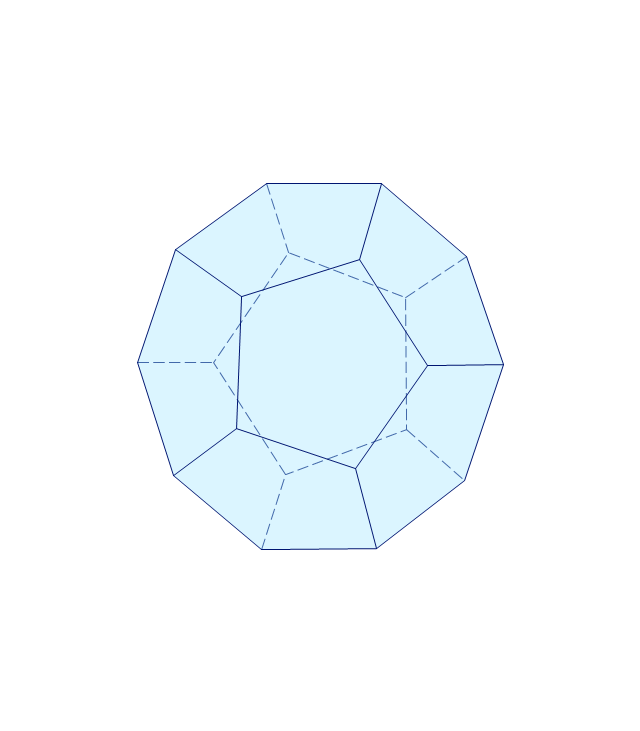
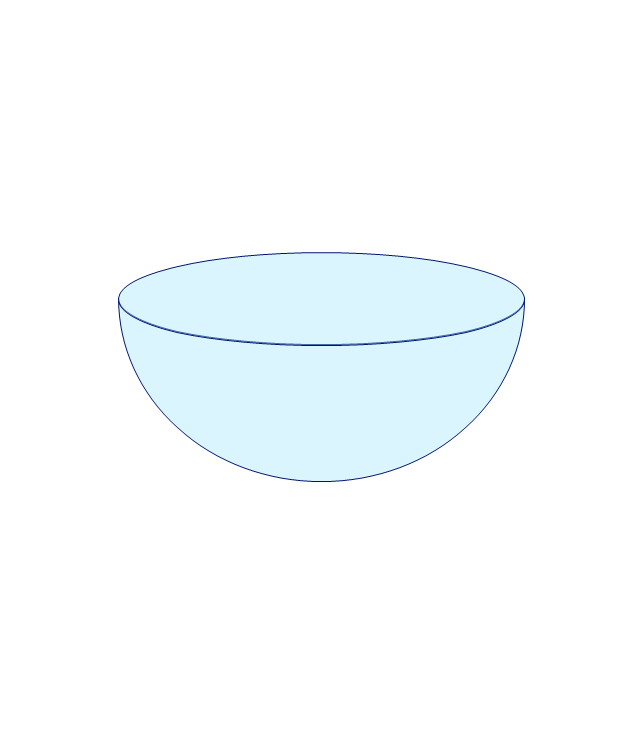
The vector stencils library "Solid geometry" contains 15 shapes of solid geometric figures.
Use these shapes to draw your geometrical diagrams and illustrations in the ConceptDraw PRO diagramming and vector drawing software extended with the Mathematics solution from the Science and Education area of ConceptDraw Solution Park.
Use these shapes to draw your geometrical diagrams and illustrations in the ConceptDraw PRO diagramming and vector drawing software extended with the Mathematics solution from the Science and Education area of ConceptDraw Solution Park.
Conical frustum

Pentagonal frustum
Tetrahedron
Cone
Cube
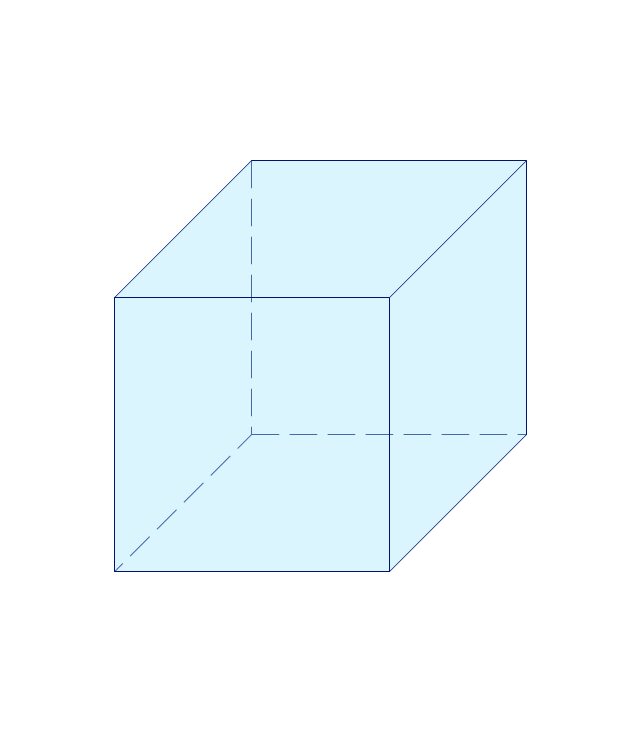
Rectangular cuboid
Regular tetrahedron
Square pyramid
Square frustum
Octahedron
Pentagonal pyramid
Irregular polyhedron
Icosahedron
Dodecahedron
Hemisphere
Spider Chart Template

 Science and Education Area
The solutions from Science and Education Area of ConceptDraw Solution Park collect templates, samples and libraries of vector stencils for drawing the scientific and educational illustrations, diagrams and mind maps.
 What are Infographic Area
Solutions of the area What is Infographics from ConceptDraw Solution Park collect templates, samples and vector stencils libraries with design elements for the drawing information graphics.
Sales Process Flowchart Symbols

- Pyramid Diagram | Design elements - Solid geometry | Design ...
- How to Draw a Pyramid Diagram in ConceptDraw PRO | Design ...
- Chart Examples | Solid geometry - Vector stencils library | Www ...
- Charts On Solid Geometry
- Solid geometry - Vector stencils library | Diagram Of Tetrahedra ...
- Design elements - Solid geometry | Drawing Geometric Shapes ...
- Design elements - Solid geometry
- Solid geometry - Vector stencils library | Geometrical Diagram Of ...
- How to Draw a Pyramid Diagram in ConceptDraw PRO | How to ...
- How to Create a Pyramid Diagram | Pyramid Diagram | Cloud ...
- Mathematics Symbols | Solid geometry - Vector stencils library ...
- Elements Of A Solid Pyramid
- Design elements - Solid geometry | Mathematical Diagrams ...
- Design elements - Solid geometry | Solid geometry - Vector stencils ...
- Use Case Diagrams technology | Solid geometry - Vector stencils ...
- Mathematical Diagrams | Scientific Symbols Chart | Mathematics ...
- Solid geometry - Vector stencils library | Type Of Cubiod With Diagram
- Mathematics Symbols | Scientific Symbols Chart | Design elements ...
- How to Create a Pyramid Diagram | How to Draw a Pyramid ...
- Best Software to Draw Diagrams . Draw Diagrams Quickly and Easily