HelpDesk
How to Create a SIPOC Diagram
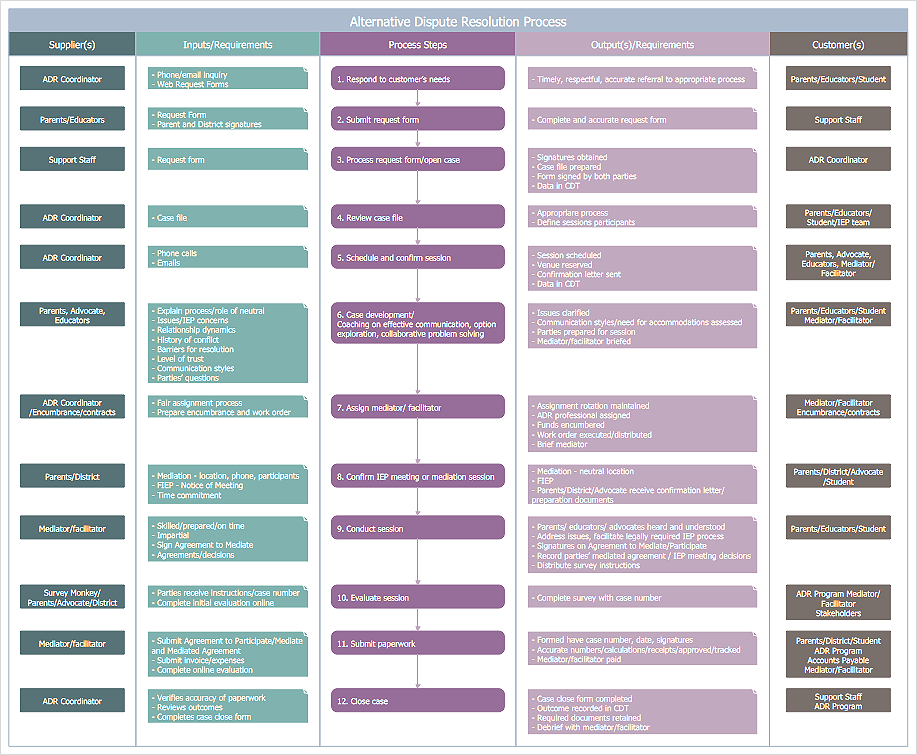
SIPOC Diagram

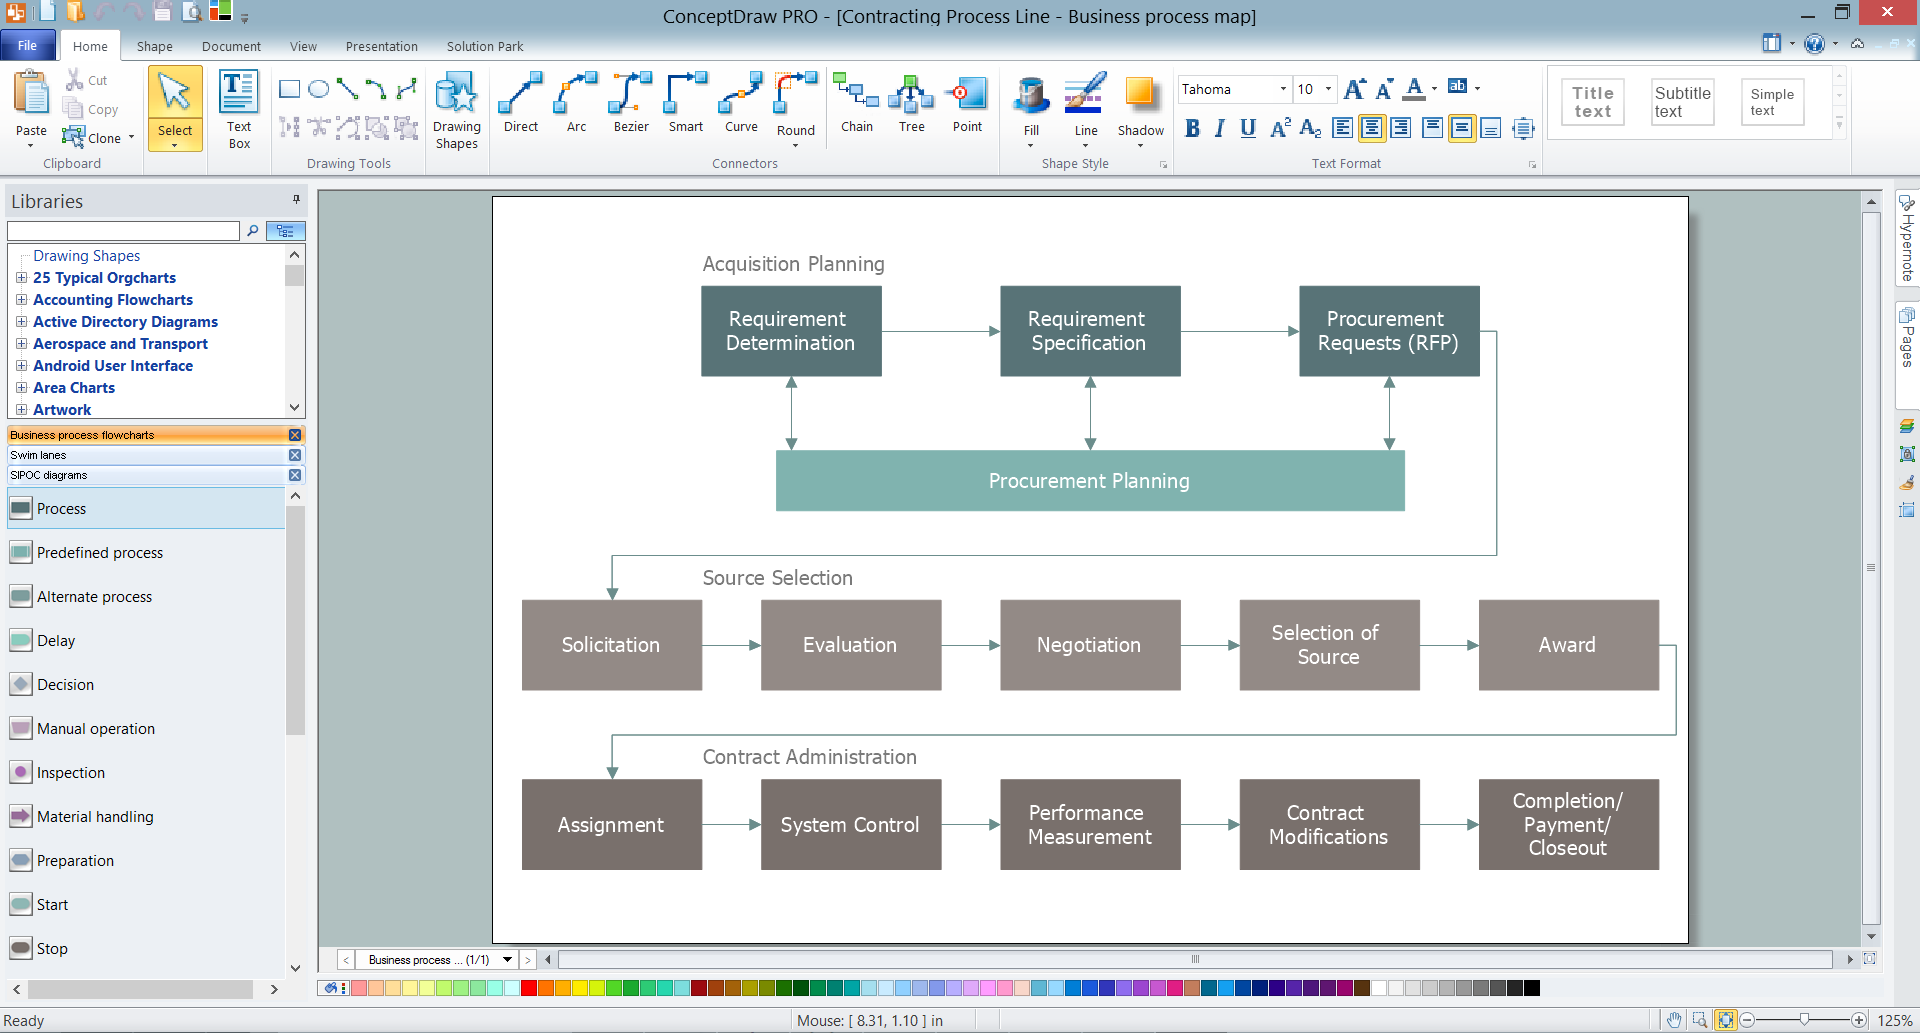
 Business Process Mapping
The Business Process Mapping solution for ConceptDraw DIAGRAM is for users involved in process mapping and creating SIPOC diagrams.
Business Process Flowchart Symbols

Blank Scatter Plot
Business Mapping Software
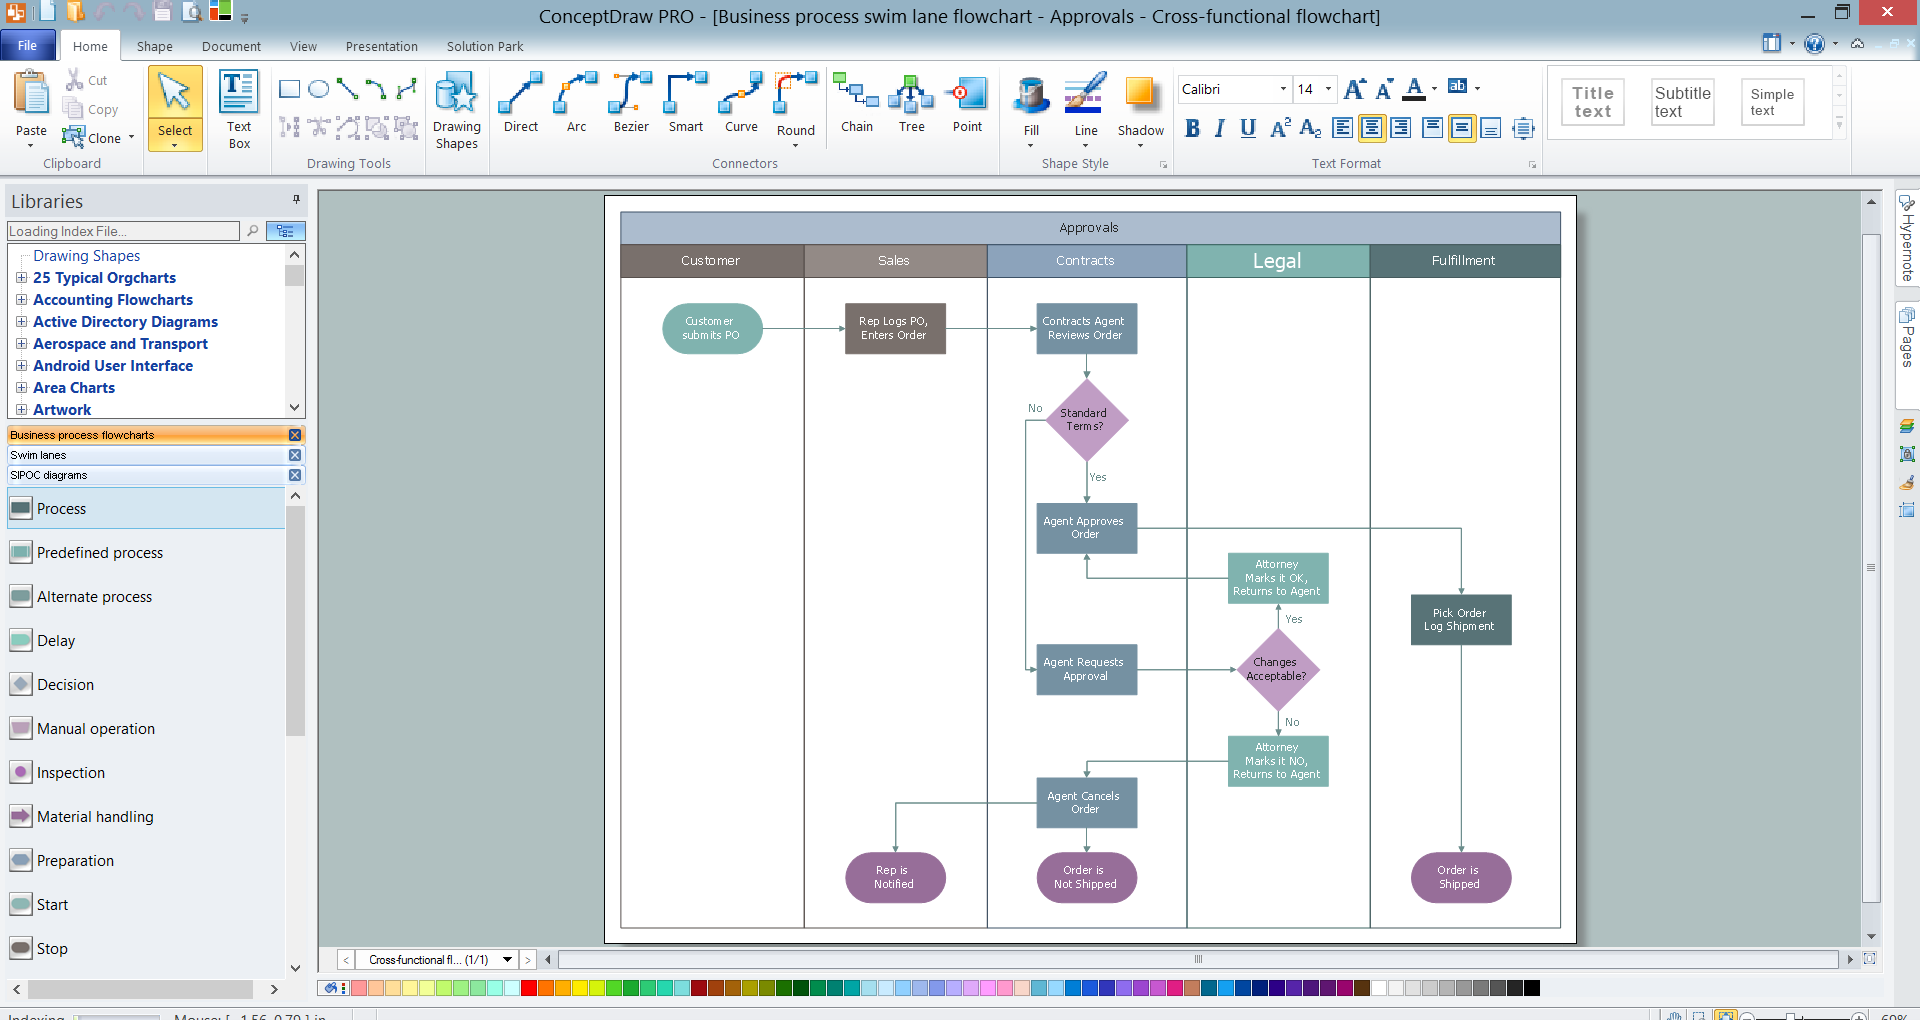
Swim Lanes
Types of Flowcharts


- How to Create a SIPOC Diagram Using ConceptDraw PRO | SIPOC ...
- Free Sipoc Diagram Template For Word Powerpoint Pdf
- How to Draw a Process Flow Diagram in ConceptDraw PRO | How ...
- Cross-Functional Process Map Template | Business Process ...
- Workflow diagram - Template | How to Create a SIPOC Diagram ...
- Business Process Mapping | MS Visio Look a Like Diagrams | In ...
- Process Map Template Visio
- Process Flowchart | SIPOC Diagram | Event-driven Process Chain ...
- Interactive Decision Tree Template