Basic Diagramming
Try ConceptDraw program, the perfect drawing tool for creating all kinds of great-looking drawings, charts, graphs, and illustrations.
Simple Drawing Applications for Mac
ConceptDraw gives the ability to draw simple diagrams like flowcharts, block diagrams, bar charts, histograms, pie charts, divided bar diagrams, line graphs, area charts, scatter plots, circular arrows diagrams, Venn diagrams, bubble diagrams, concept maps, and others.Simple Diagramming
Create flowcharts, org charts, floor plans, business diagrams and more with ConceptDraw PRO.
Concept Map
A concept map is a way of representing relationships between ideas, images, or words. How to draw a Concept Map quick, easy and effective? ConceptDraw PRO offers the unique Concept Maps Solution from the "Diagrams" Area that will help you!The Best Mac Software for Diagramming or Drawing
ConceptDraw PRO is a powerful intelligent vector graphics engine that can be used to create basic diagrams including flowcharts, charts, workflows, flowcharts, organizational charts, business diagram, learn business diagrams, flow diagrams.
Basic Diagramming
Create flowcharts, organizational charts, bar charts, line graphs, and more with ConceptDraw PRO.
Basic Diagramming
Mathematics is an exact science, which studies the values, spatial forms and quantitative relations. It is a science, in which is built large number of various diagrams, charts and graphs that present the material in a clear, visual and colorful form, help to analyze the information and to make certain conclusions. A diagram is a graphical representation of data using the linear segments or geometric shapes, which allows to evaluate the ratio of several values. Depending on the types of solved tasks are used the diagrams of different kinds. A graph is a diagram that shows quantitative dependencies of various processes using the curves. ConceptDraw PRO is a powerful intelligent and multifunctional vector engine for drawing different Mathematical diagrams and graphs, Mathematical illustrations, complex and simple Diagram mathematics, Flowcharts of equation solving process, Line graphs, Scatter plots, Histograms, Block diagrams, Bar charts, Divided bar diagrams, Pie charts, Area charts, Circular arrows diagrams, Venn diagrams, Bubble diagrams, Concept maps, and many others.
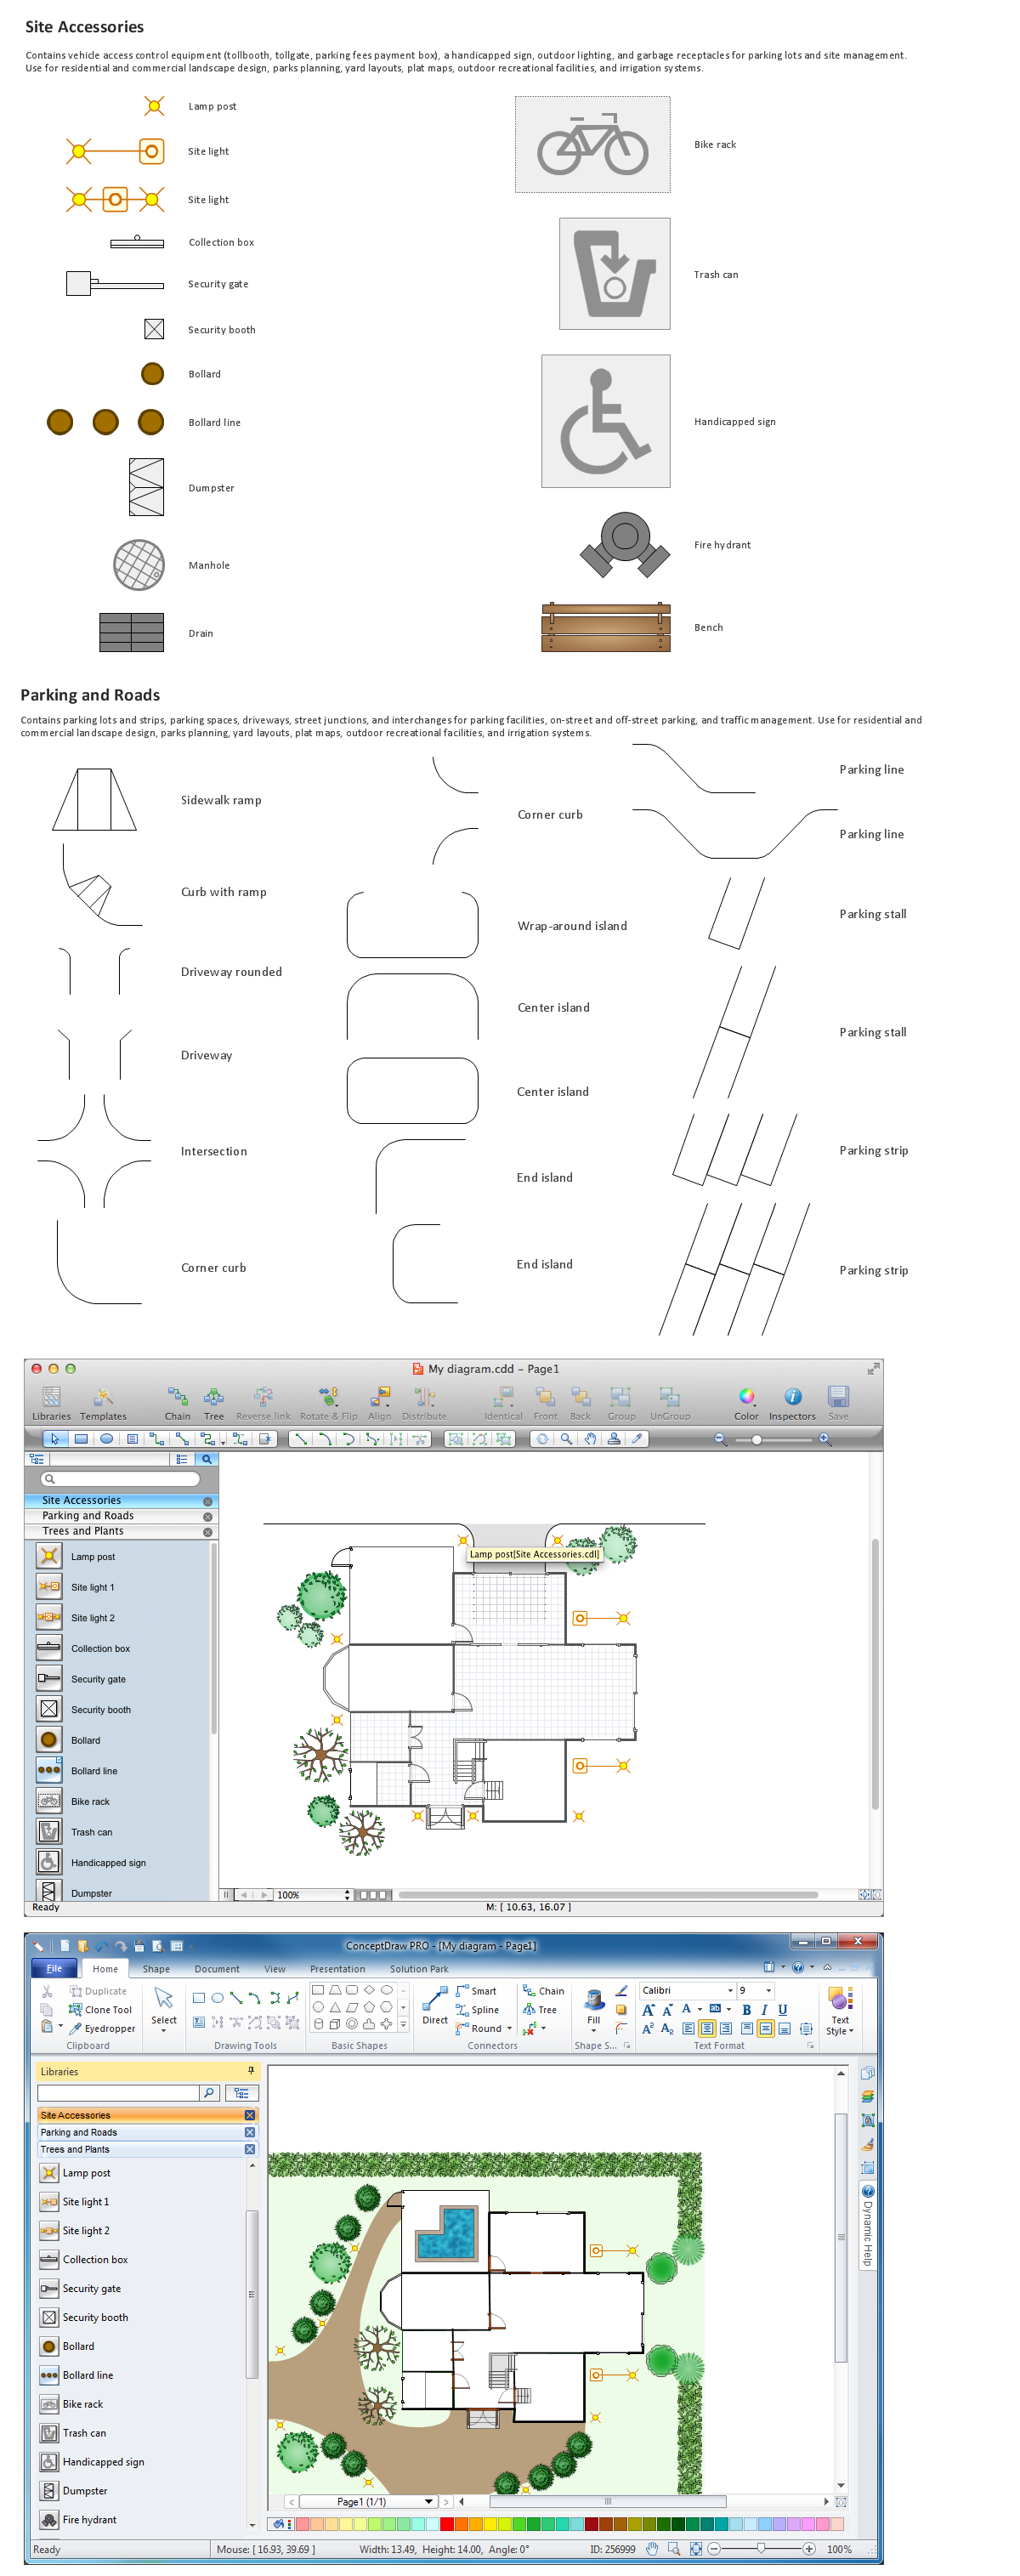
Building Drawing Software for Design Site Plan
Site plan is a detailed architectural plan or document, landscape architecture project for considered object. It is a part of technical design documentation that illustrates the arrangement of buildings, trails, roads, parking, lighting, water lines, sanitary sewer lines, drainage facilities, landscape and garden elements. Site plans are constructed by architects, landscape designers or licensed design engineers, and used by the builders, contractors and installers when constructing or making improvements to some property. They reflect the main design ideas and give an instantly vision of future result after the plan's implementation. They have special value for the large projects of single or multi-floor buildings, and for accomplishment the whole districts. ConceptDraw PRO extended with Site Plans solution offers the powerful building drawing software tools and vector design elements for development and drawing Site plans and Landscape design drawings, Residential and Commercial landscape designs, Parks and Landscaping territories plans, Yard layouts, etc.
HelpDesk
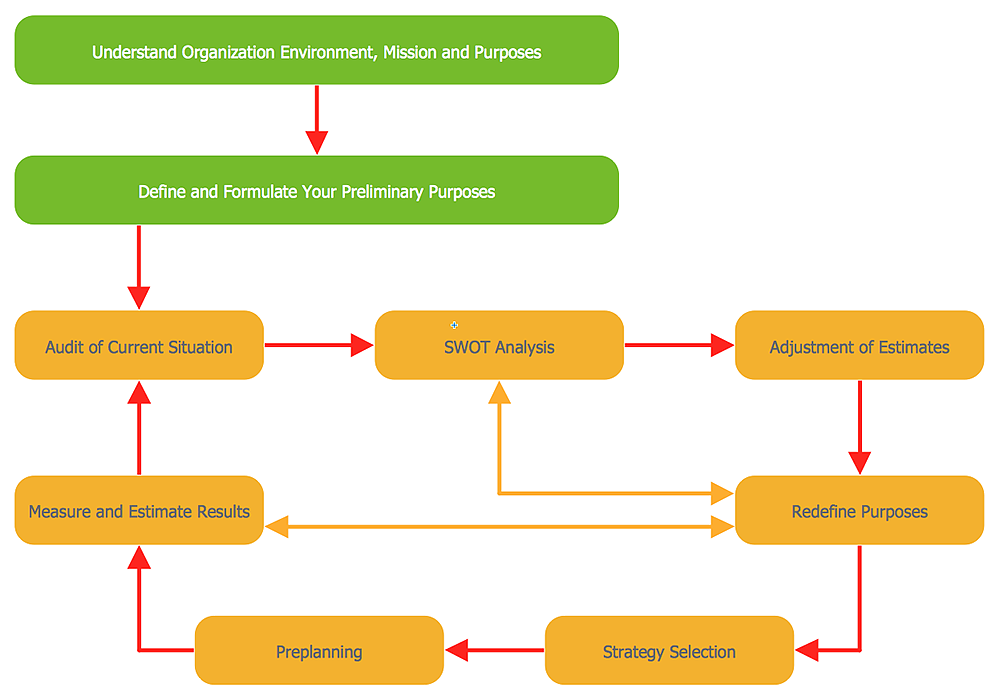
How to Start Drawing a Diagram on Mac
In this tutorial we will explain how to create a simple chart in ConceptDraw PRO using a template, and how to use the library objects.- Concept Maps | Simple Diagramming | Concept Map Maker | Simple ...
- Draw Concepts
- Computer and Networks Area | Concept Software Drawing
- Bubble Map Maker | Concept Maps | Process Flowchart | Simple
- ConceptDraw Software Full Versions Free Download | Concept ...
- Concept Of Drawing
- Drawing Of Concept Map
- Conception Drawing
- Concept Map Of Business Communication
- Process Flowchart | Basic Diagramming | Simple Diagramming ...


