Venn Diagram

Business Tools Perceptual Mapping

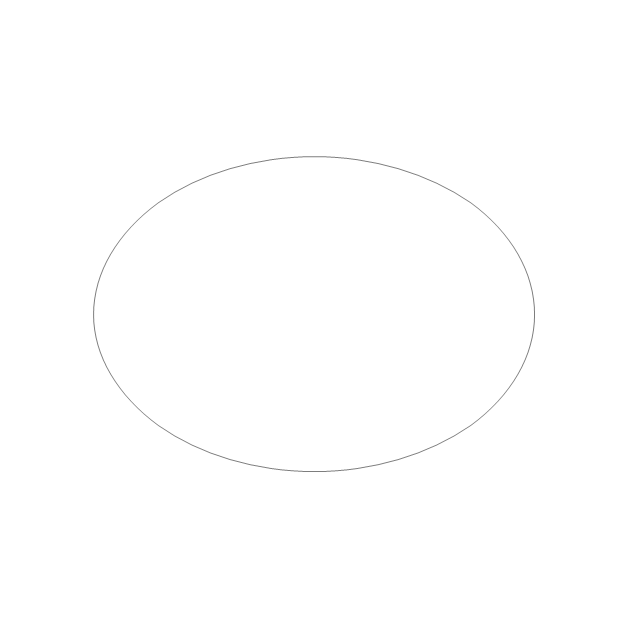
The vector stencils library "Plane geometry" contains 27 plane geometric figures.
Use these shapes to draw your geometrical diagrams and illustrations in the ConceptDraw PRO diagramming and vector drawing software extended with the Mathematics solution from the Science and Education area of ConceptDraw Solution Park.
Use these shapes to draw your geometrical diagrams and illustrations in the ConceptDraw PRO diagramming and vector drawing software extended with the Mathematics solution from the Science and Education area of ConceptDraw Solution Park.
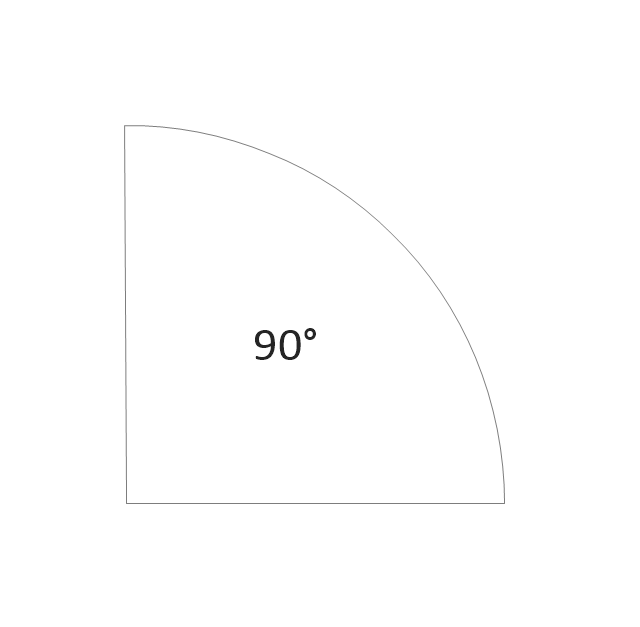
Circular sector
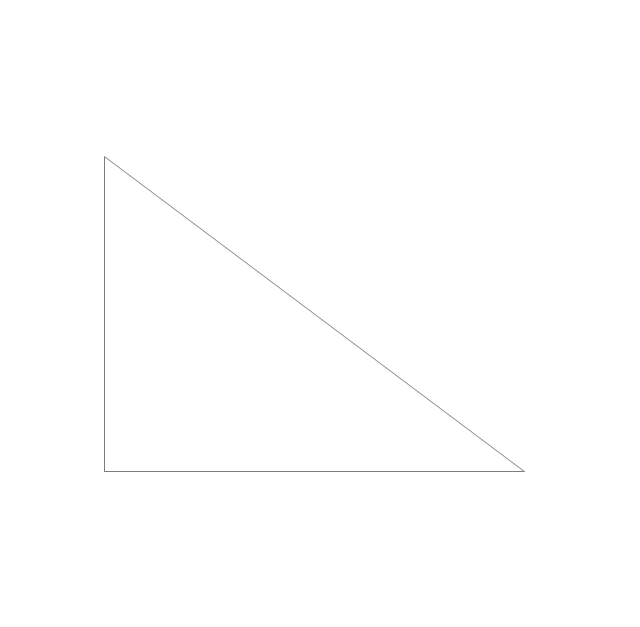
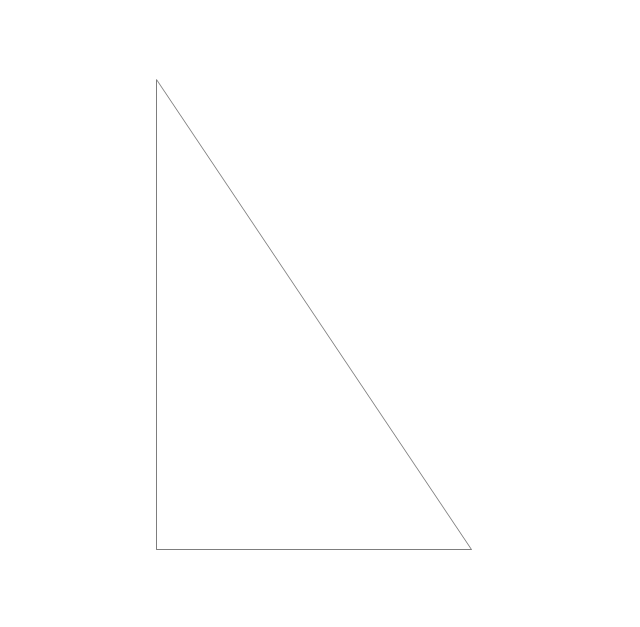
Right triangle
Rectangle

Square

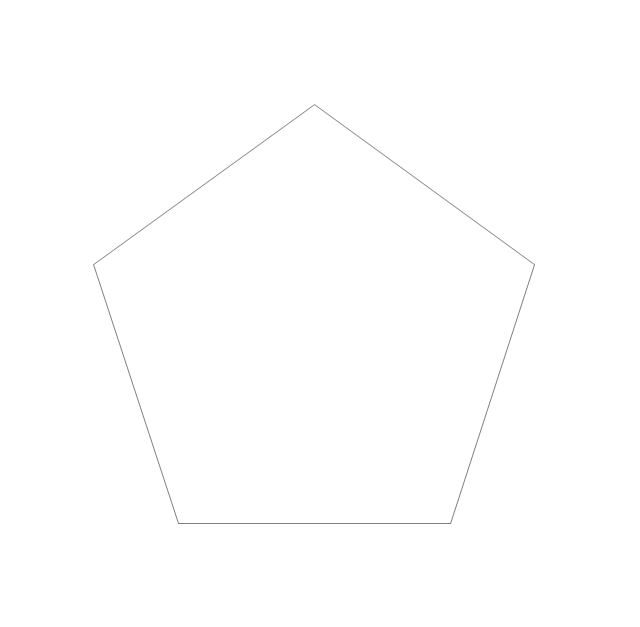
Pentagon
Isosceles trapezium
Parallelogram
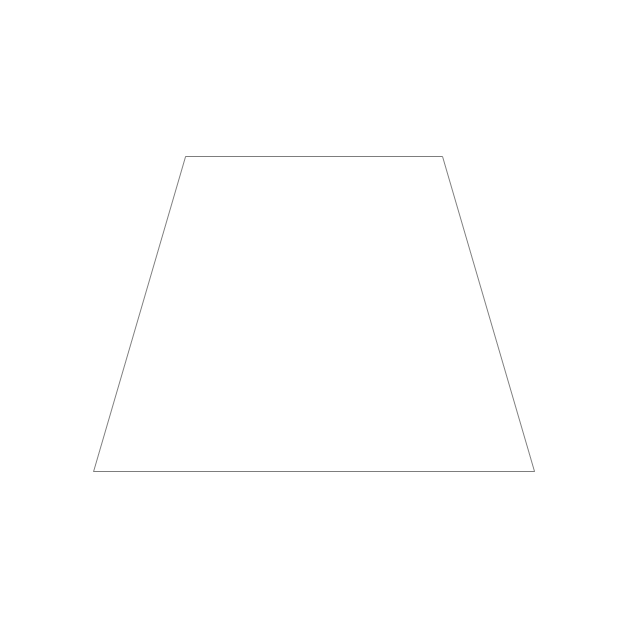
Trapezium
Three-pointed star

Four-pointed star

Five-pointed star

Six-pointed star

Seven-pointed star

Eight-pointed star

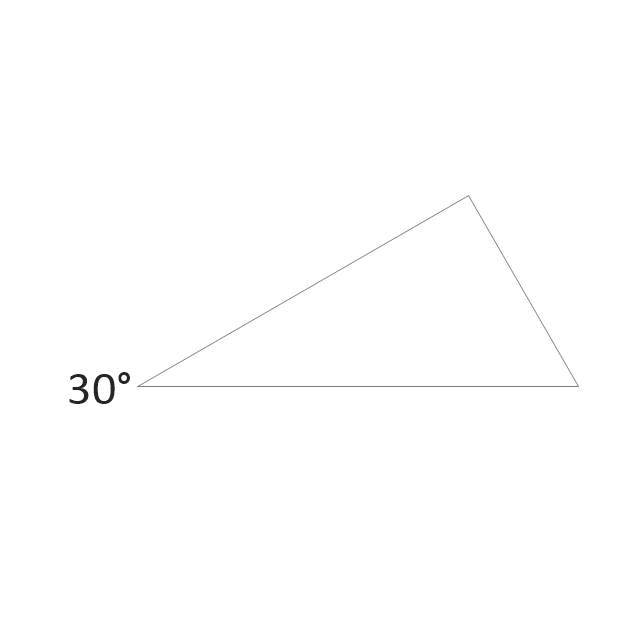
Triangle
Equilateral triangle
Right triangle 2
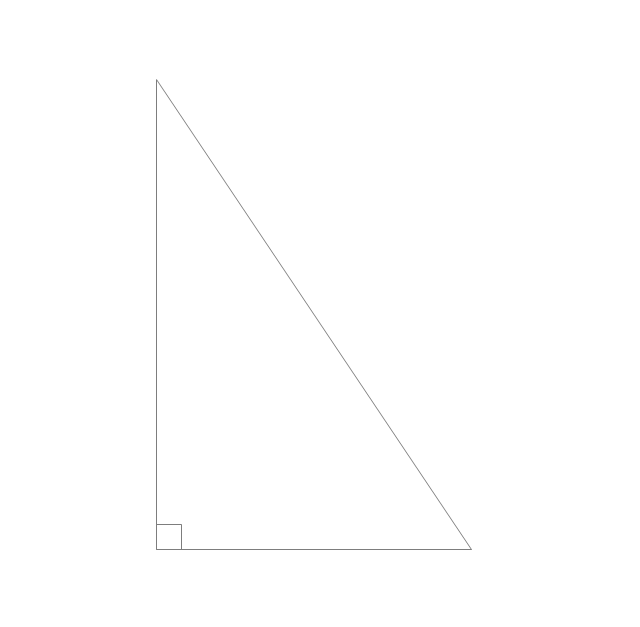
Right triangle, angle box
Right triangle 3
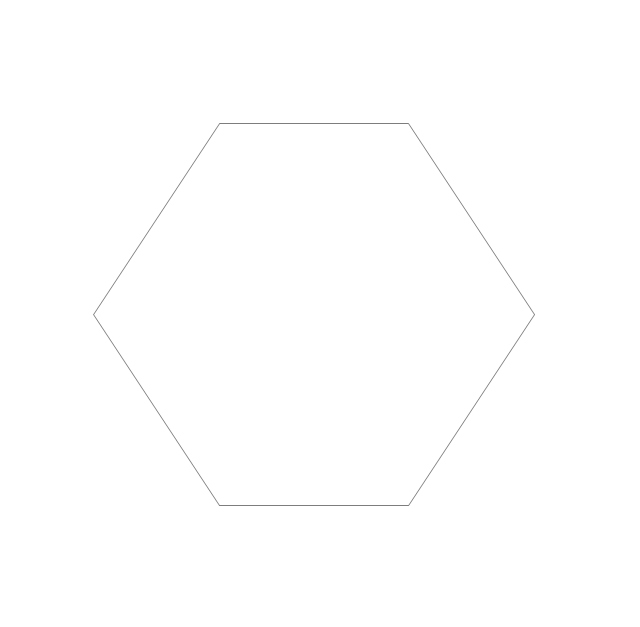
Hexagon
Regular hexagon
Regular pentagon
Regular heptagon
Regular octagon
Rhombus

Circle

Ellipse
HelpDesk
How to Add a Bubble Diagram to PowerPoint Presentation

HelpDesk
How to Create a Bubble Diagram

IDEF4 Standard

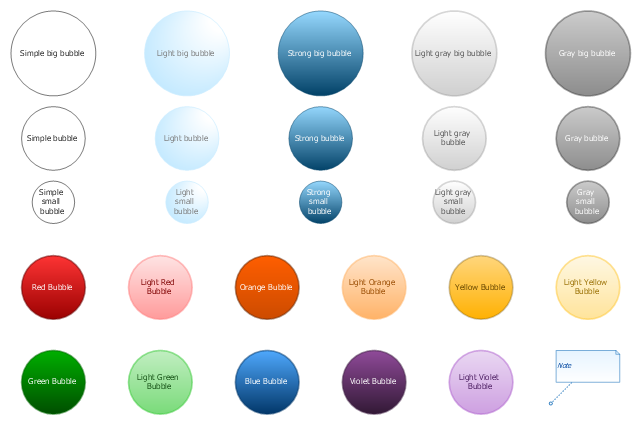
The vector stencils library "Bubble diagrams" contains 28 shapes for creating the bubble diagrams, bubble maps and concept maps using the ConceptDraw DIAGRAM diagramming and vector drawing software.
"What Is a Bubble Diagram?
A bubble diagram is a type of map where ellipses or rectangles are connected by solid, broken or wavy lines. Bubble diagrams can be used to compare concepts, and identify areas of similarity and difference. They are at times referred to as bubble charts or spray diagrams." [ask.com/ question/ what-is-a-bubble-diagram]
The shapes example "Design elements - Bubble diagrams" is included in Business Diagrams solution from Management area of ConceptDraw Solution Park.
Bubble diagram shapes
Electrical Symbols — Rotating Equipment

Biology Drawing

 Block Diagrams
Block diagrams solution extends ConceptDraw PRO software with templates, samples and libraries of vector stencils for drawing the block diagrams.
- Similarities Between Flow Chart And Algorithm
- Similarities Between Entity Relationship Diagram And Data Flow
- Stakeholder Onion Diagram Template | Differences And Similarities ...
- Cross-Functional Flowcharts | Sales Flowcharts | Similarities Of ...
- Similarities Between Mesh And Ring Topology
- Similarities Between Dfd Diagram And Erd Diagrams
- Similarities Between Bus And Tree Topology
- Similarities Between Bus And Mesh Topology
- Similarities Between Gantt Chart And Pert
- Similarities Between Entities Relationship Diagram And Dataflow